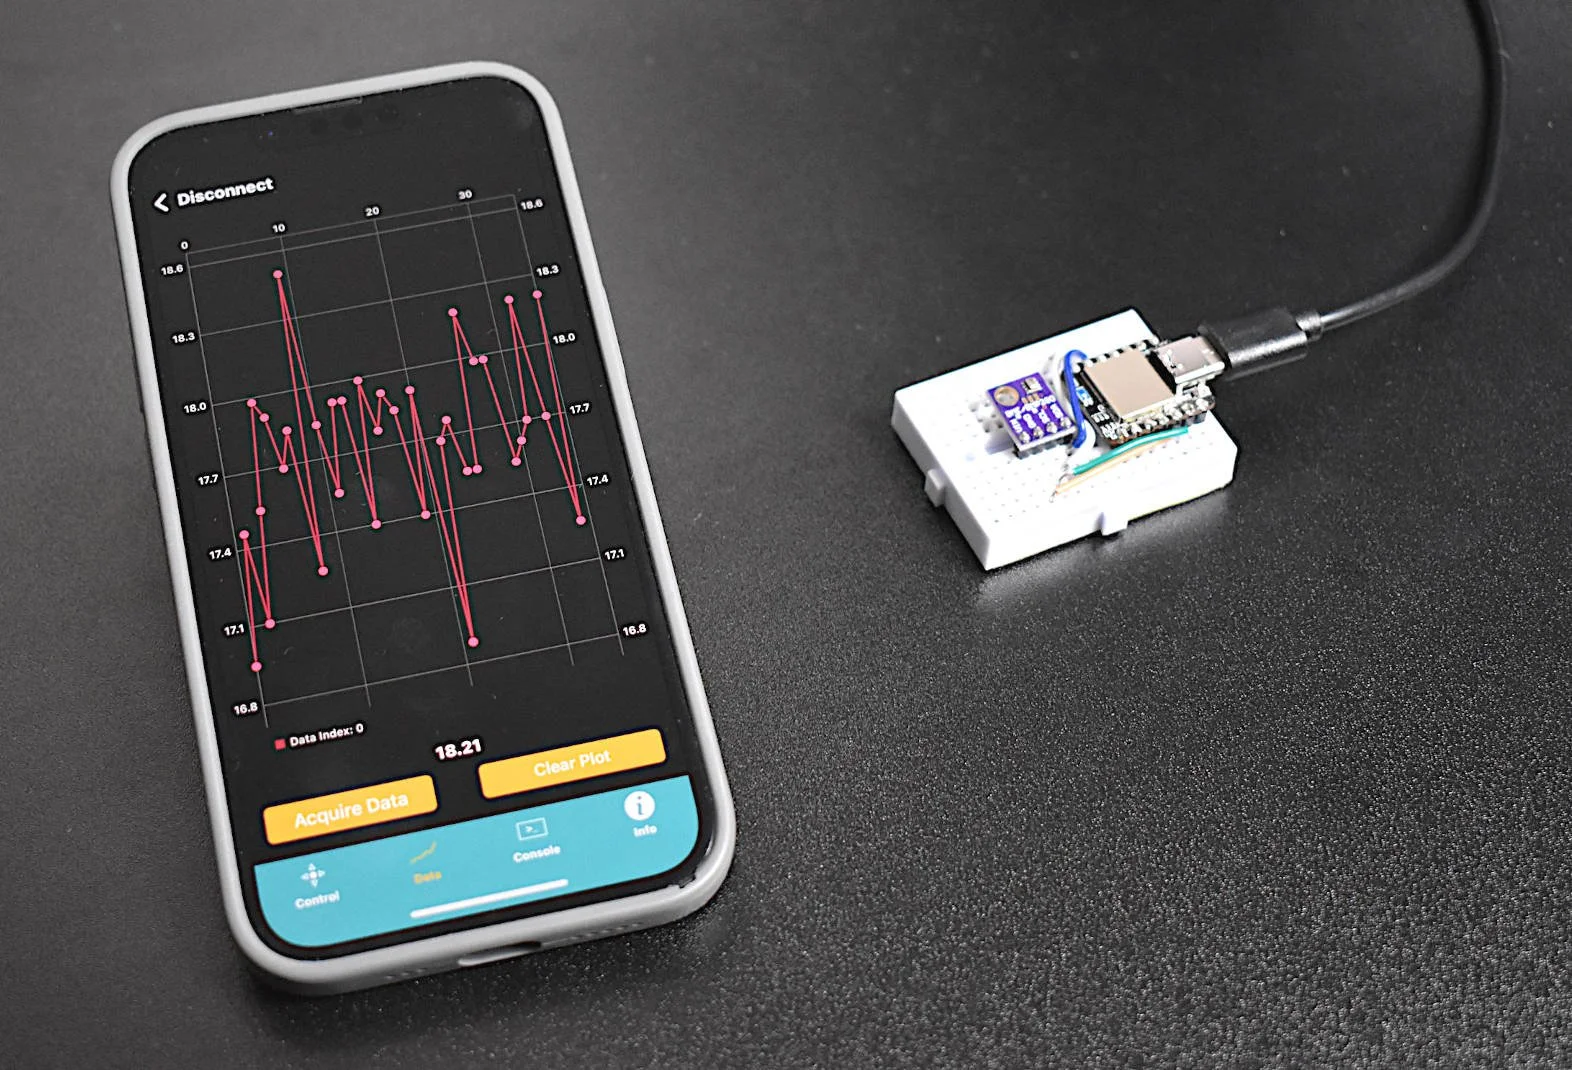
Arduino Sensor Data Logging and Visualization on iPhone
This is the second entry into the tutorial series centered around the MakerBLE Arduino board. Using the BLExAR iOS app again, we are able to monitor the incoming data from the MakerBLE board, plot the values, and save them to a comma-separated value (CSV) file. The data being sent is read from a BMP280 sensor over the I2C port by the MakerBLE board. Temperature, atmospheric pressure, and approximate altitude were all sent over the BLE connection with an iPhone.
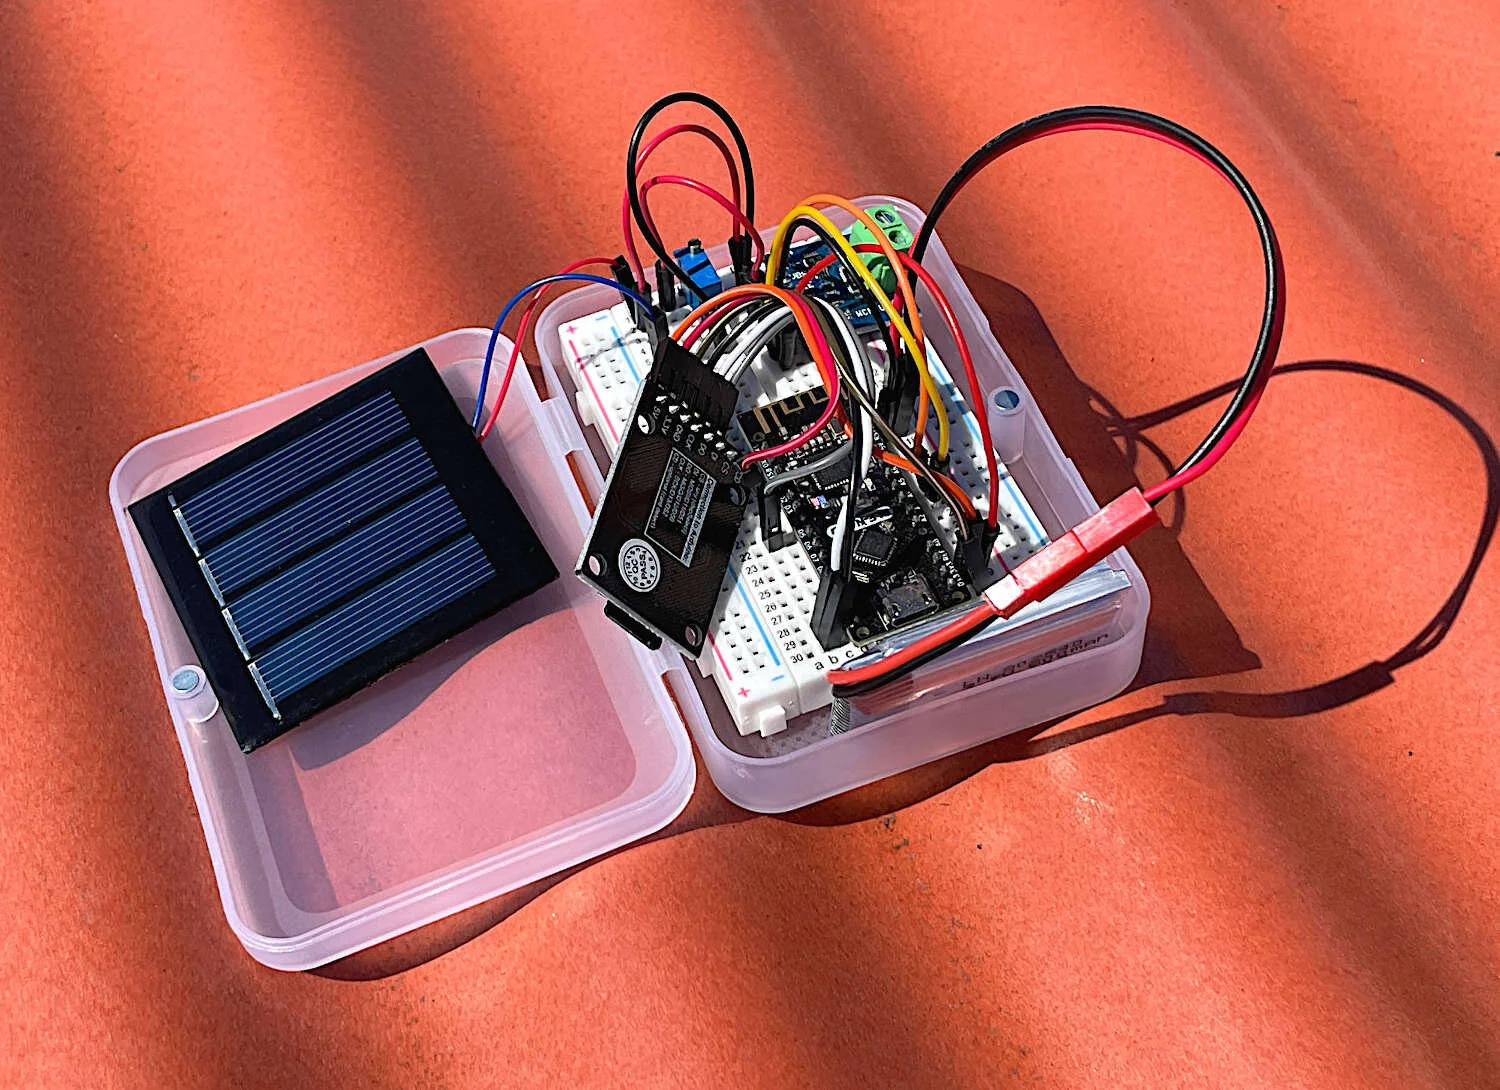
Solar Panel Characterization and Experiments with Arduino
In this tutorial, the aim is to characterize a solar panel by varying the load at (near) peak solar insolation to identify the panel's nominal values such as open-circuit voltage, short-circuit current, max power voltage and current, and max power output. These values help users understand the expectations from a photovoltaic array and how their power needs may be met with a given PV system. An Arduino board will be used to log the current and voltage values outputted from a small solar panel. The current and voltage are measured using a 16-bit analog-to-digital converter power module, the INA226, which will allow us to track the power outputted from the photovoltaic panel. A potentiometer acting as a rheostat will serve as the varying load on the system, which will be used to identify the peak power points of the system. Finally, analyses will be conducted in Python 3, which will allow us to identify the peak power region and also the total power outputted over a duration of 24 hours.
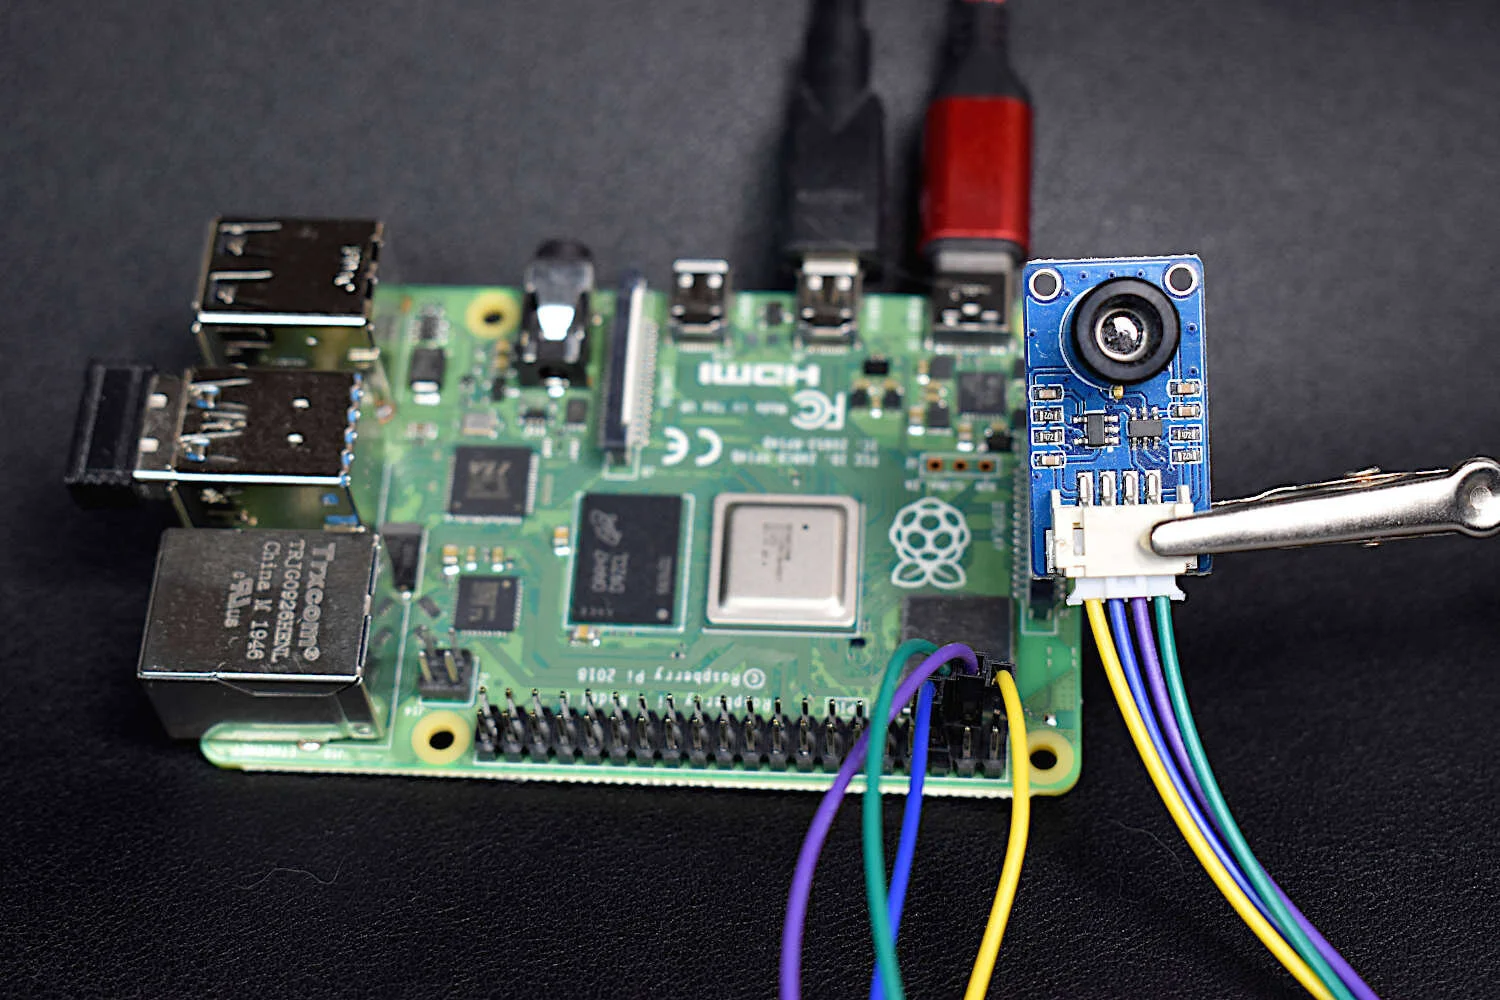
High Resolution Thermal Camera with Raspberry Pi and MLX90640
Thermal cameras are similar to standard cameras in that they use light to record images. The most significant distinction is that thermal cameras detect and filter light such that only the infrared region of the electromagnetic spectrum is recorded, not the visible region [read more about infrared cameras here]. Shortly after the discovery of the relationship between radiation and the heat given off by black bodies, infrared detectors were patented as a way to predict temperature via non-contact instrumentation. In recent decades, as integrated circuits shrink in size, infrared detectors have become commonplace in applications of non-destructive testing, medical device technology, and motion detection of heated bodies. The sensor used here is the MLX90640 [datasheet], which is a 768 pixel (24x32) thermal camera. It uses an array of infrared detectors (and likely filters) to detect the radiation given off by objects. Along with a Raspberry Pi computer, the MLX90640 will be used to map and record fairly high-resolution temeperature maps. Using Python, we will be able to push the RPI to its limits by interpolating the MLX90640 to create a 3 frame-per-second (fps) thermal camera at 240x320 pixel resolution.
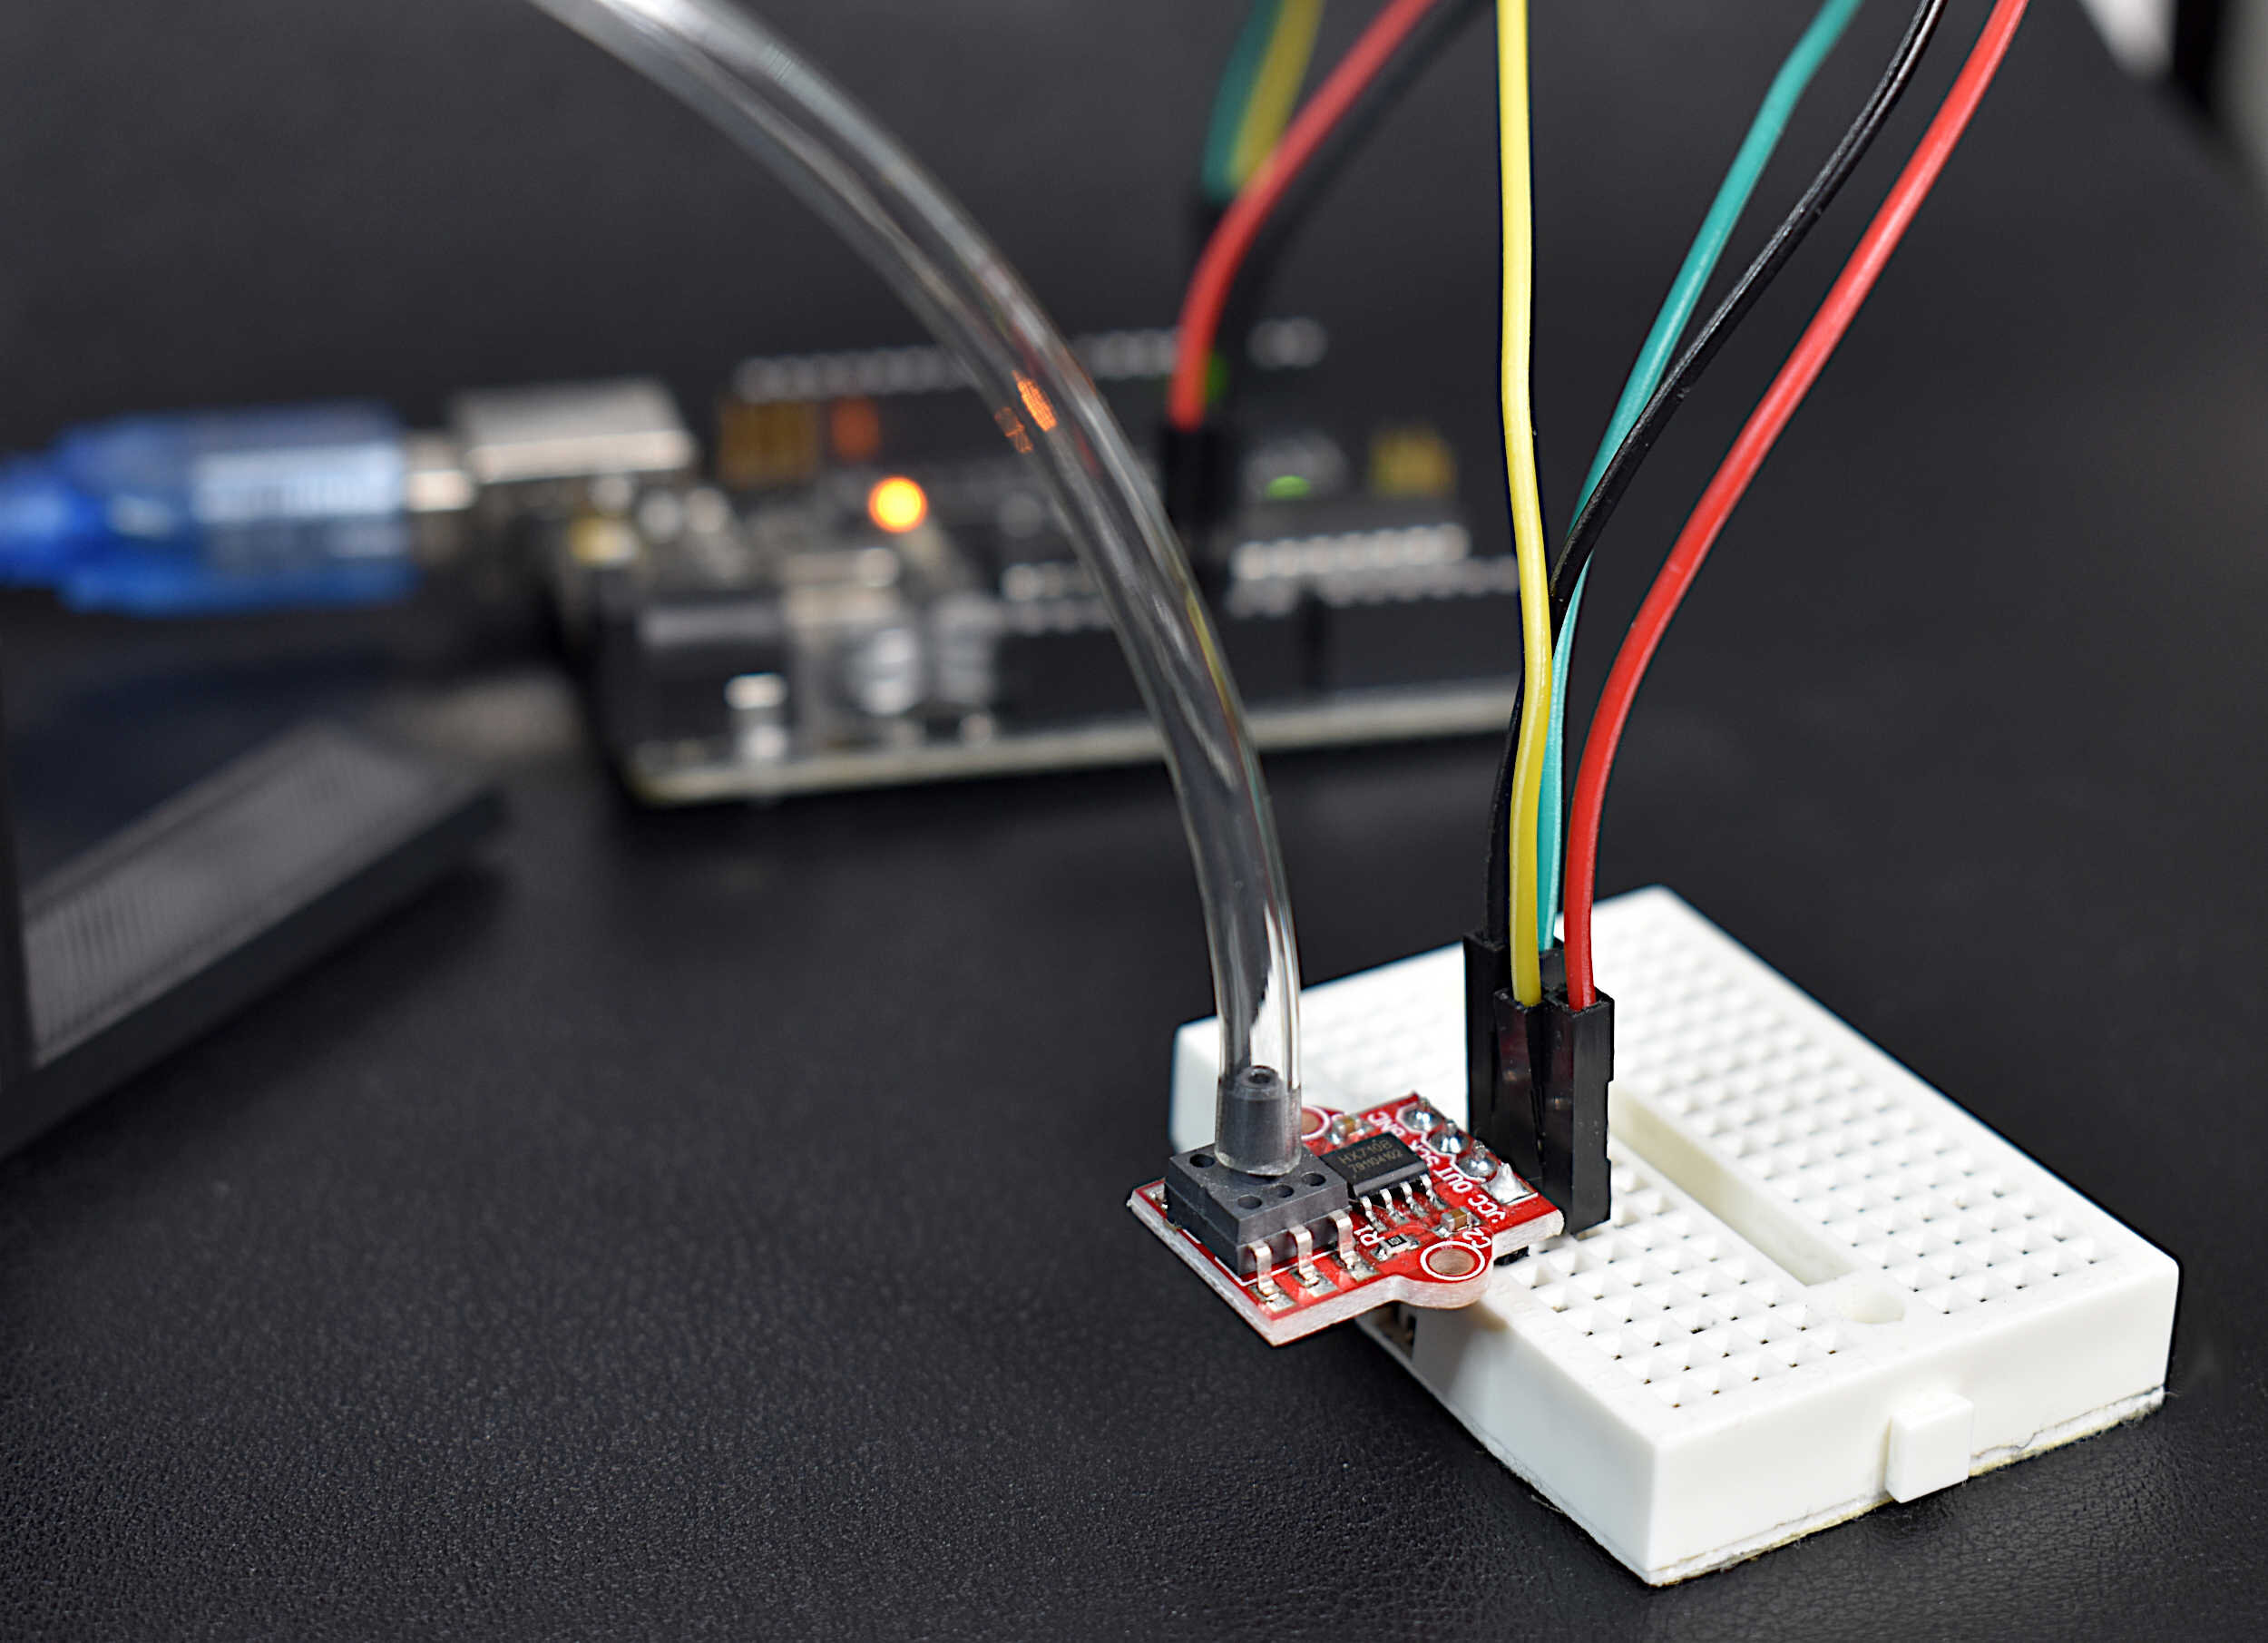
MPS20N0040D Pressure Sensor Calibration with Arduino
Pressure is defined as an evenly distributed force acting over a surface with a given area. The accurate measurement of pressure is essential for applications ranging from material testing to weighing scales, aircraft altitude prediction, and evaluating biological functions in humans relating to respiration and blood flow In this tutorial, a digital pressure transducer and analog pressure manometer will be used to measure gauge pressure - where the analog manometer is used as the calibration tool for the digital pressure sensor. Arduino will be used to read the digital pressure transducer, an MPS20N0040D, and a 3D printed manometer will be used to measure analog pressure manually.
Python FTP for Data Mining and Analysis
Python’s file transfer protocol (FTP) library is used to parse weather station data from the publicly available automated surface observing system (ASOS) from the U.S.A.’s National Climatic Data Center (NCDC). Several programmatic tools available in Python are used to automate the parsing of weather data, as well as visualizing the resulting data.

Arduino GPS Tracker
The NEO-6 is a miniature GPS module designed by u-blox to receive updates from up to 22 satellite on 50 different channels that use trilateration to approximate fixed position of a receiver device every second (or less, for some modules). The particular module used in this tutorial, the NEO-6M, is capable of updating its position every second and communicates with an Arduino board using UART serial communication. The NEO-6M uses the National Marine Electronics Association (NMEA) protocol which provides temporal and geolocation information such as Greenwich Mean Time (GMT), latitude, longitude, altitude, and approximate course speed. The NEO-6M and Arduino board will also be paired with an SD module to create a portable logger that acts as a retrievable GPS tracker.
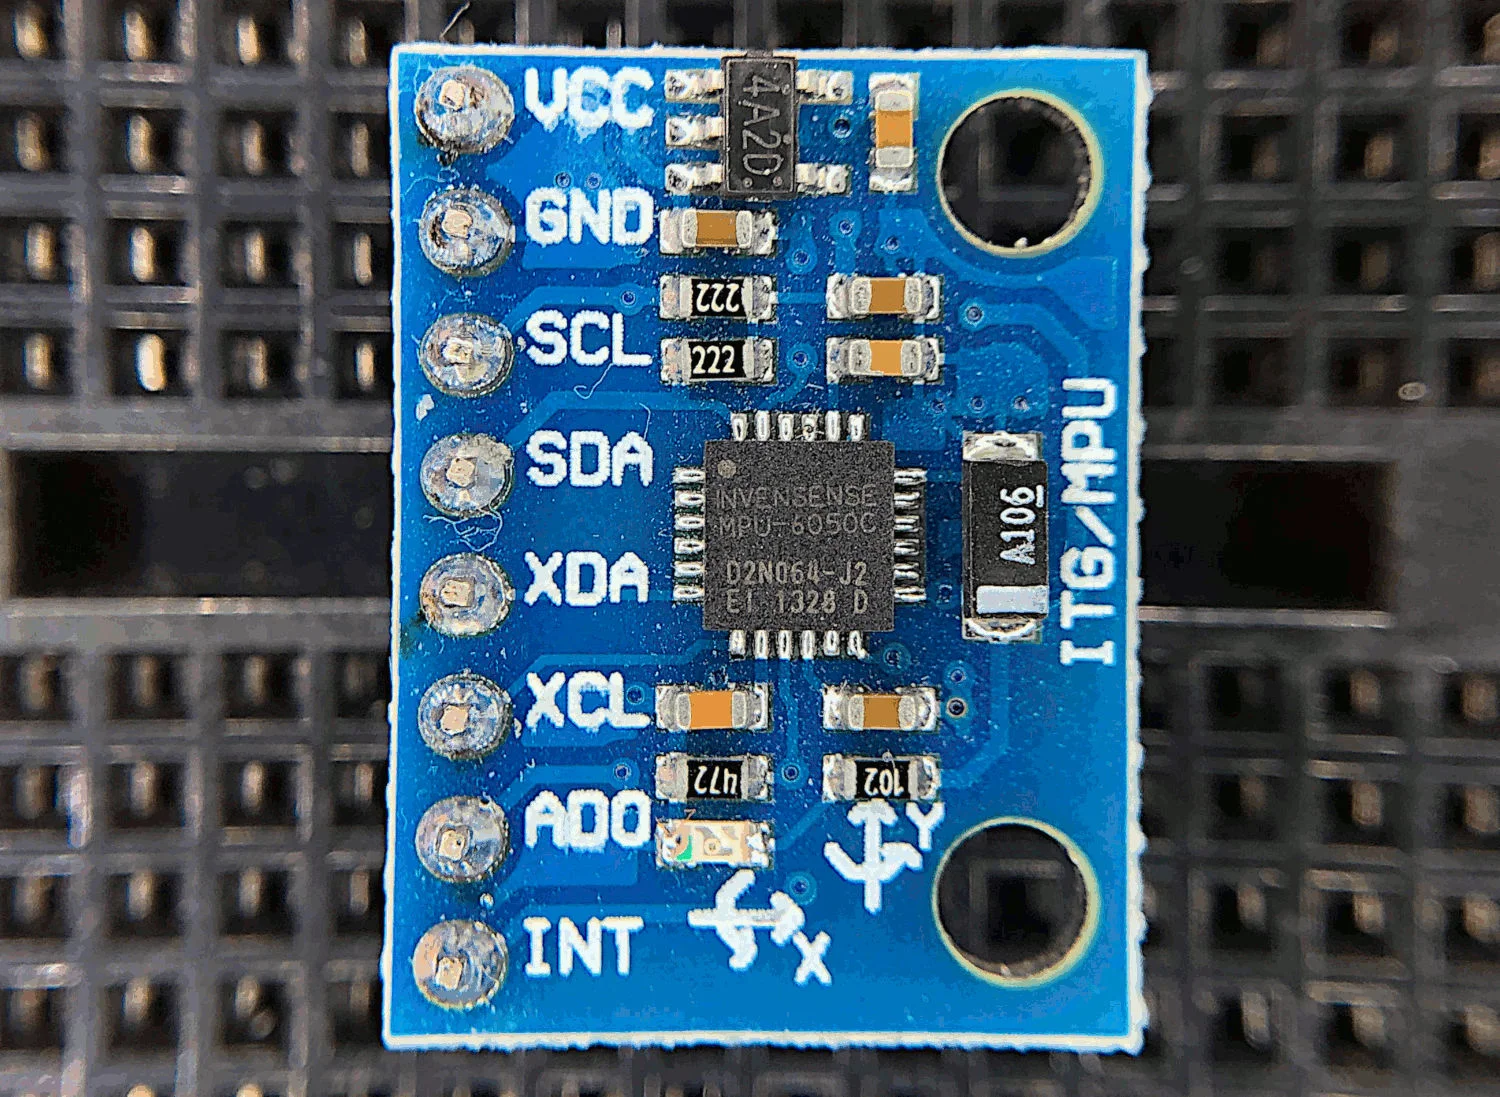
MPU6050 Arduino High-Frequency Accelerometer and Gyroscope Data Saver
The MPU6050 is a 6-DoF (degree of freedom) accelerometer and gyroscope that is designed for inexpensive, small-scale, and efficient approximation of motion. Accelerometers and gyroscopes are used in smart phones for orientation detection, vibration analysis in vehicles and machines, and even camera stabilization and motion tracking. There are countless applications for accelerometers and gyroscopes, and with devices as accessible as the MPU6050, we can really test the limits of the technology.

Arduino + VL53L1X Time of Flight Distance Measurement
Time of flight (ToF) is an approximation of the time it takes a traveling wave to come in contact with a surface and reflect back to the source. Time of flight has applications in automotive obstacle detection, resolving geographic surface composition, and computer vision and human gesture recognition. In the application here, the VL53L1X ToF sensor will be used to track the displacement of a ping pong ball falling down a tube. We can predict the acceleration and behavior of a falling ping pong ball by balancing the forces acting on the ball, and ultimately compare the theory to the actual displacement tracked by the time of flight sensor.

Arduino SD Card Module Data Logger
This tutorial will explore the range of capabilities available to the Arduino SD library by using a real-world example of data logging. The SD library allows users to read/write, list files, create/remove files, and make/delete directories. Additionally, we will develop an algorithm that creates a new file every time the Arduino board is restarted, which will prevent overwriting of existing data records. The resulting data file will be in comma separated format and contain multiple data points, including a time stamp in milliseconds since the program started. Therefore, it is important to record the program start time. For very accurate time monitoring tasks, a real-time clock is recommended, however, for the experiments conducted here, relative time suffices.

Loudspeaker Analysis and Experiments: Part II
Part II of the tutorial series on loudspeaker analysis and experiments. The majority of this entry focuses on finding Thiele-Small parameters to fully characterize an electrodynamic loudspeaker in free air.
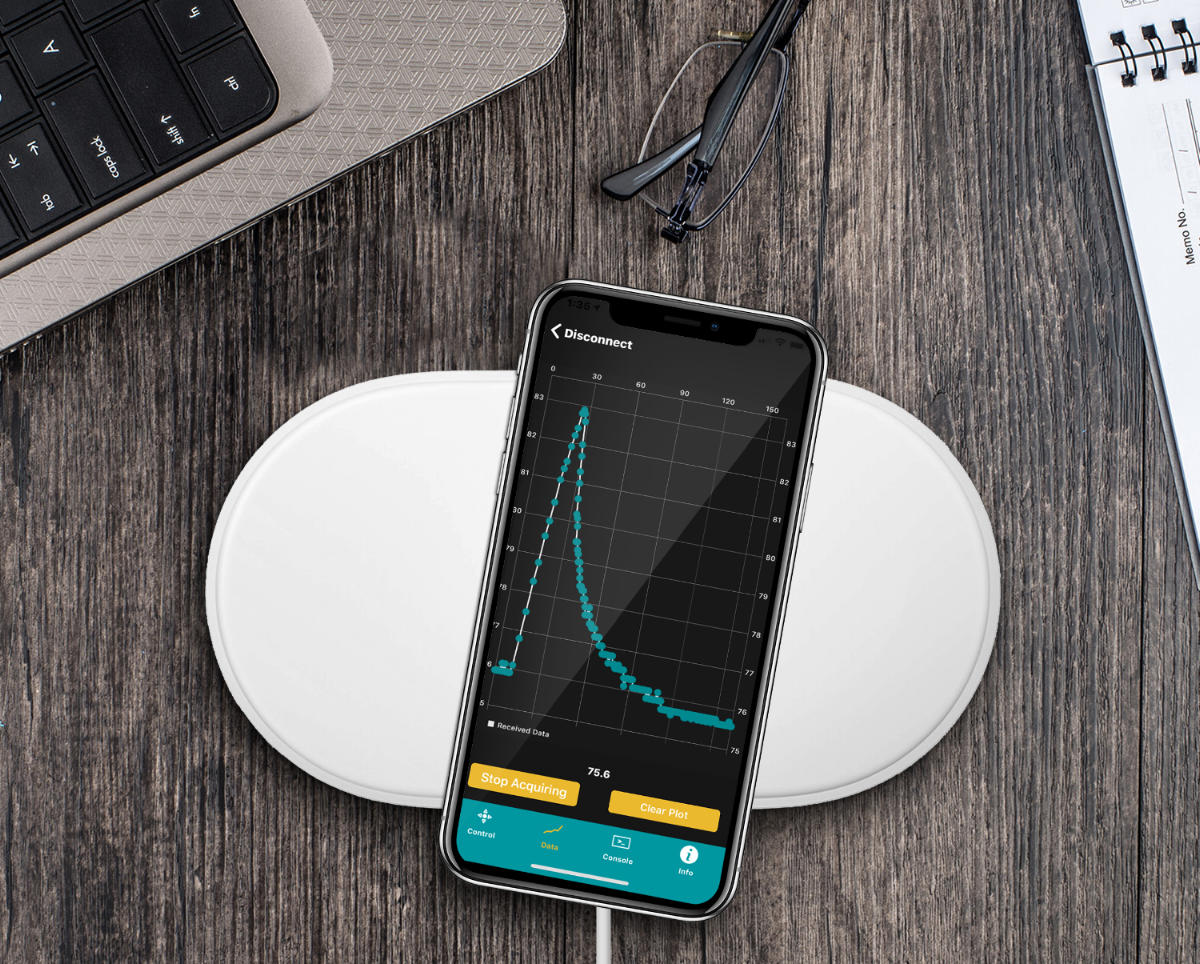
iPhone Datalogger with Arduino Using The iOS Bluetooth App BLExAR
The BLExAR app will be used in conjunction with a CC2541 (HM-10, JDY-08, AT-09, SH-M08) Bluetooth module and an Arduino (ATmega328) board to create a simple data acquisition system. A DHT22 sensor will provide temperature and humidity data to the Arduino which will be recorded by an iOS device via the BLExAR app. This experiment is a real-world example of an Arduino application demonstrating data acquisition from a real sensor. This tutorial will allow users to solve their own engineering problems using the modern Arduino platform and wireless communication through the BLExAr app, which will ultimately expand the reach and compatibility of technology in the classical sciences through exploration and experimentation.


Geospatial Analysis Using QGIS and Open-Source Data
Geographic information systems (GIS) are powerful tools used by climatologists, health organizations, defense agencies, real-estate companies, and nearly all professions that rely on location-based data. Geographic data is often very cumbersome to analyze traditionally, which is why visualization tools are essential. Depending on the size and complexity of the data, several robust GIS softwares exist on the market from open-source (free) to paid subscriptions. Each software has its strengths and weaknesses, so depending on the application one software may be more effective than another. A few of the leading softwares are: GE Smallworld, Google Earth Pro, AutoCAD Map 3D, and Maptitude. QGIS is an open-source competitor to ArcGIS, which is arguably the industry leader in the GIS market, so for financial and ease-of-application reasons, QGIS is employed here. I will also cover four scales of geographic analysis: one at the city level (NYC), one at the state level (Washington State), one at the country level (U.S.A.), and one at the world level. The goal is to demonstrate the power and breadth of geographic information systems at any scale.
