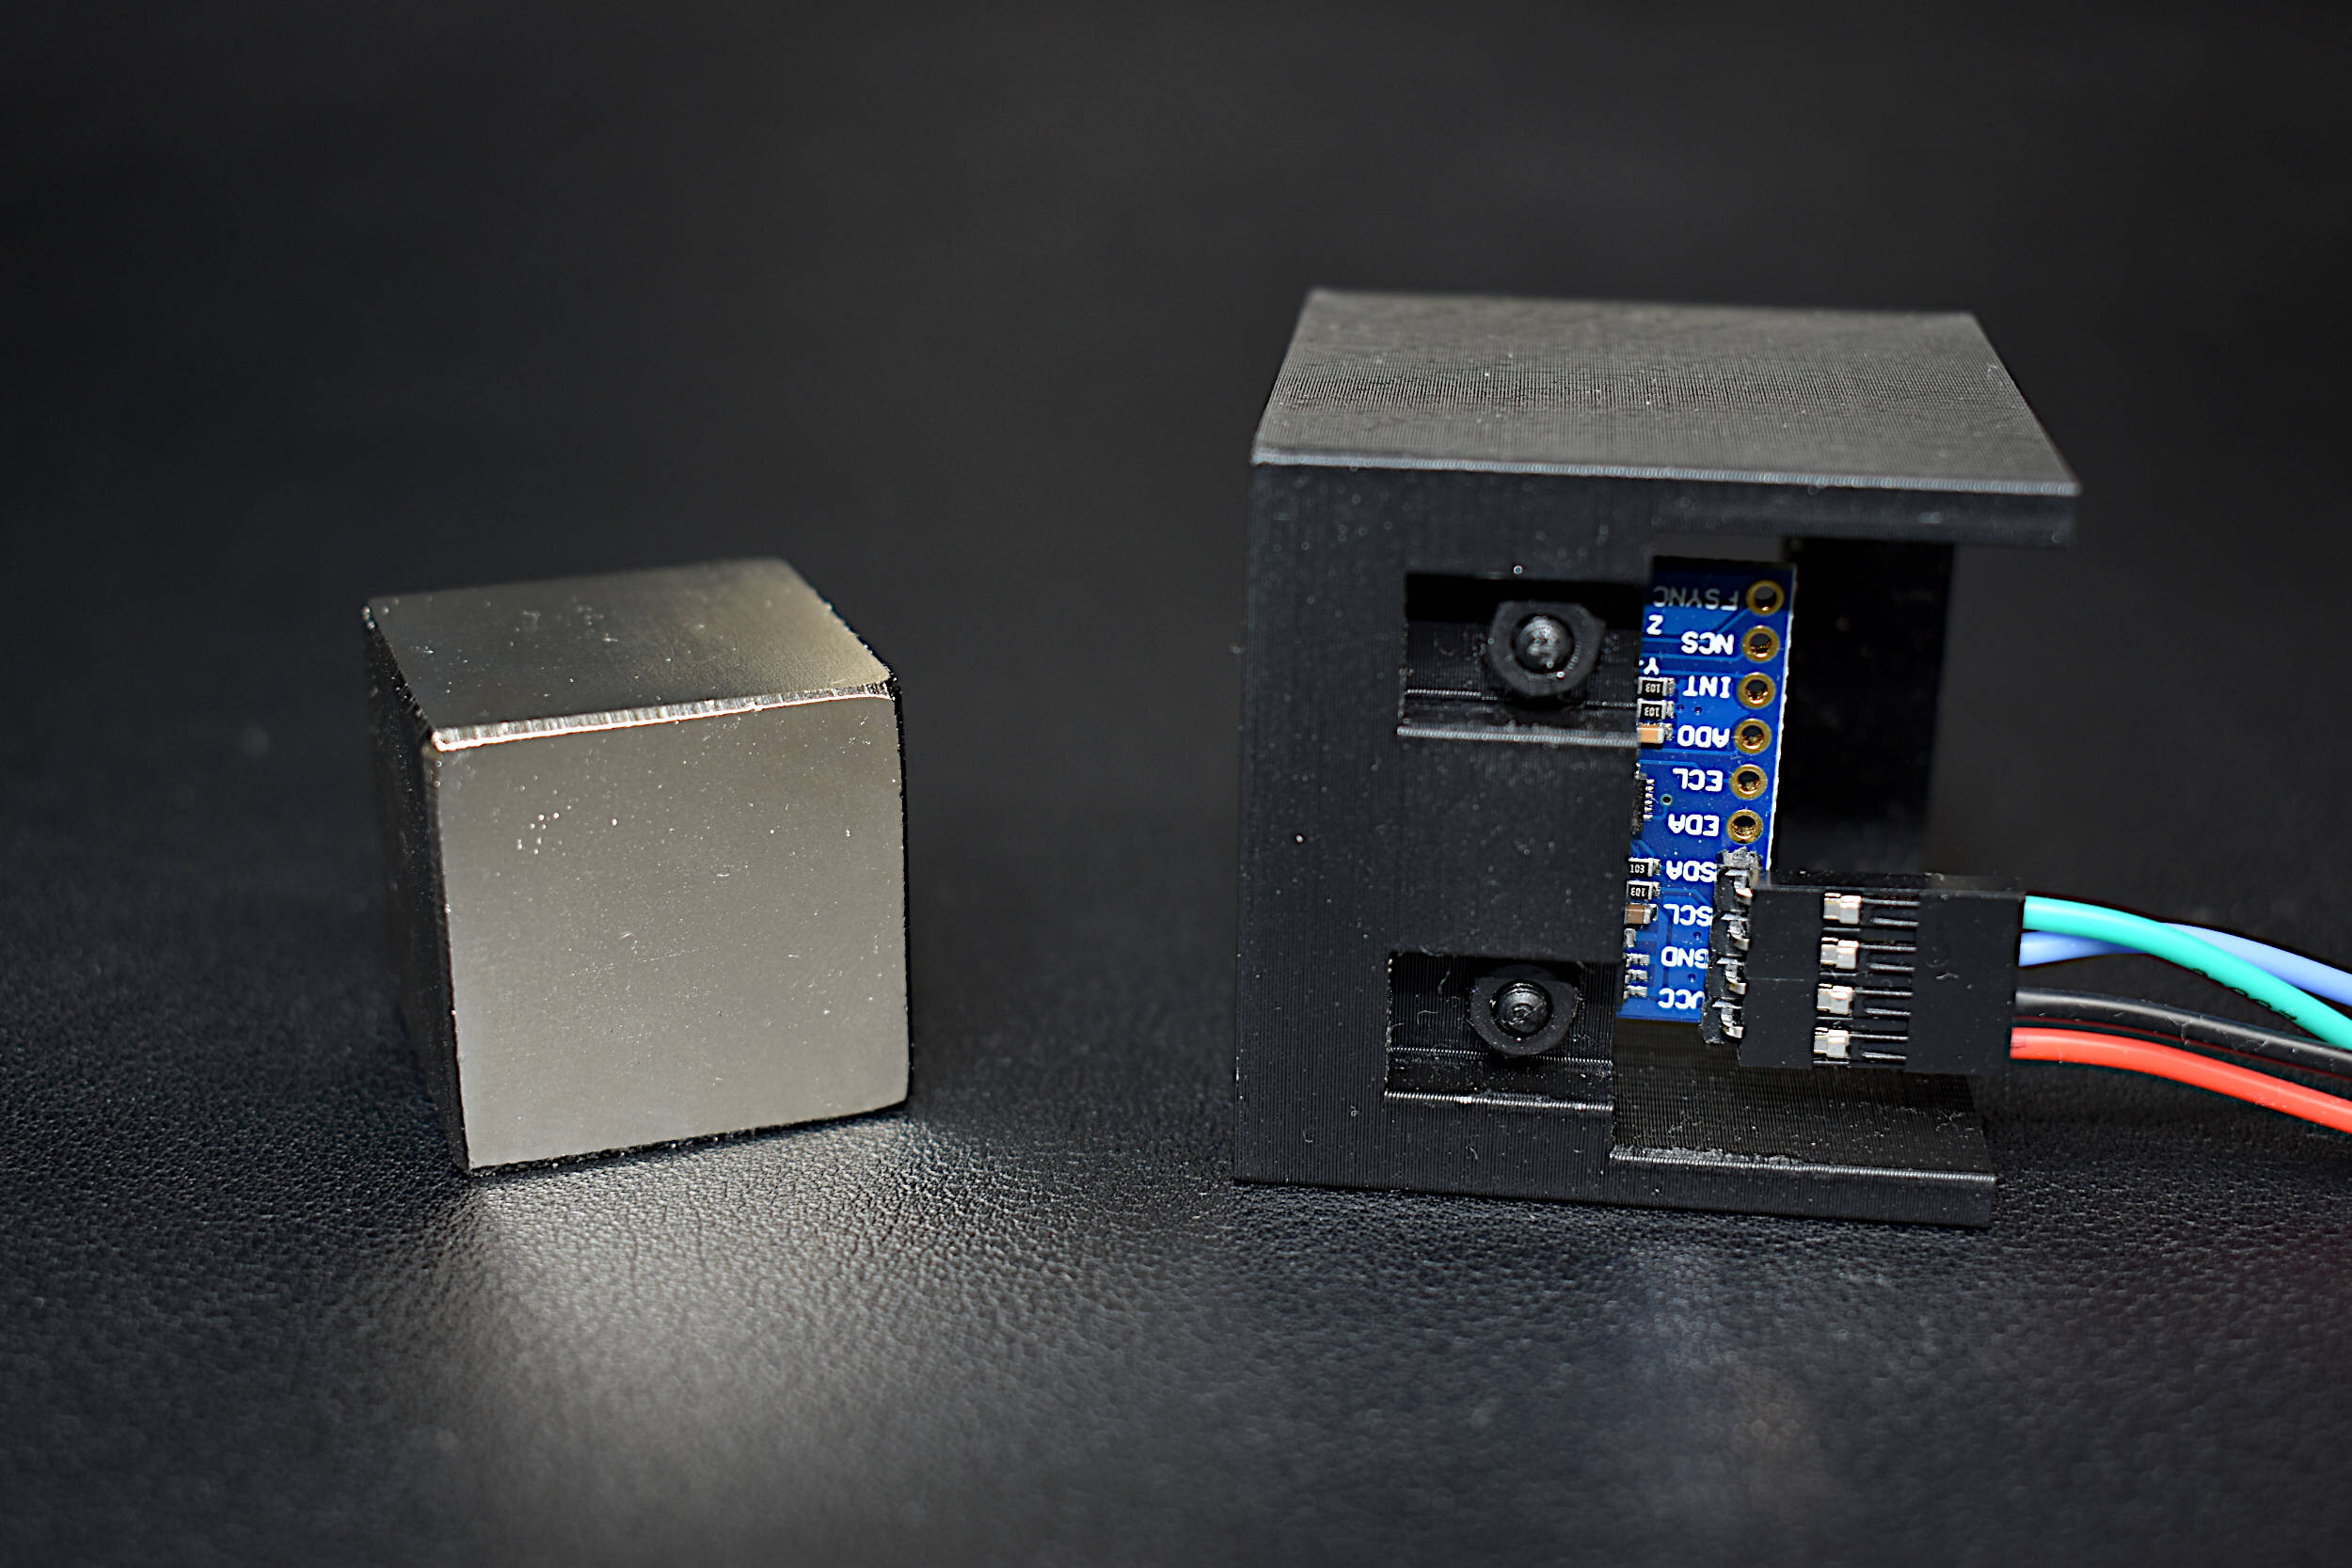
Calibration of a Magnetometer with Raspberry Pi
In this tutorial, methods for calibrating a magnetometer aboard the MPU9250 is explored using our Calibration Block. The magnetometer is calibrated by rotating the IMU 360° around each axis and calculating offsets for hard iron effects. Python is again used as the coding language on the Raspberry Pi computer in order to communicate and record data from the IMU via the I2C bus. The second half of this tutorial gives a full calibration routine for the IMU's accelerometer, gyroscope, and magnetometer. The final implementation will allow for moderate (first-order) calibration of the MPU9250 under reasonable conditions, requiring only the calibration block and IMU. Finally, the complete final code will save the coefficients for each sensor for future use in direct applications without the need for constant calibration. The use of the calibration coefficients will allow for improved estimates of orientation, displacement, vibration, and other relevant control and measurement analyses.

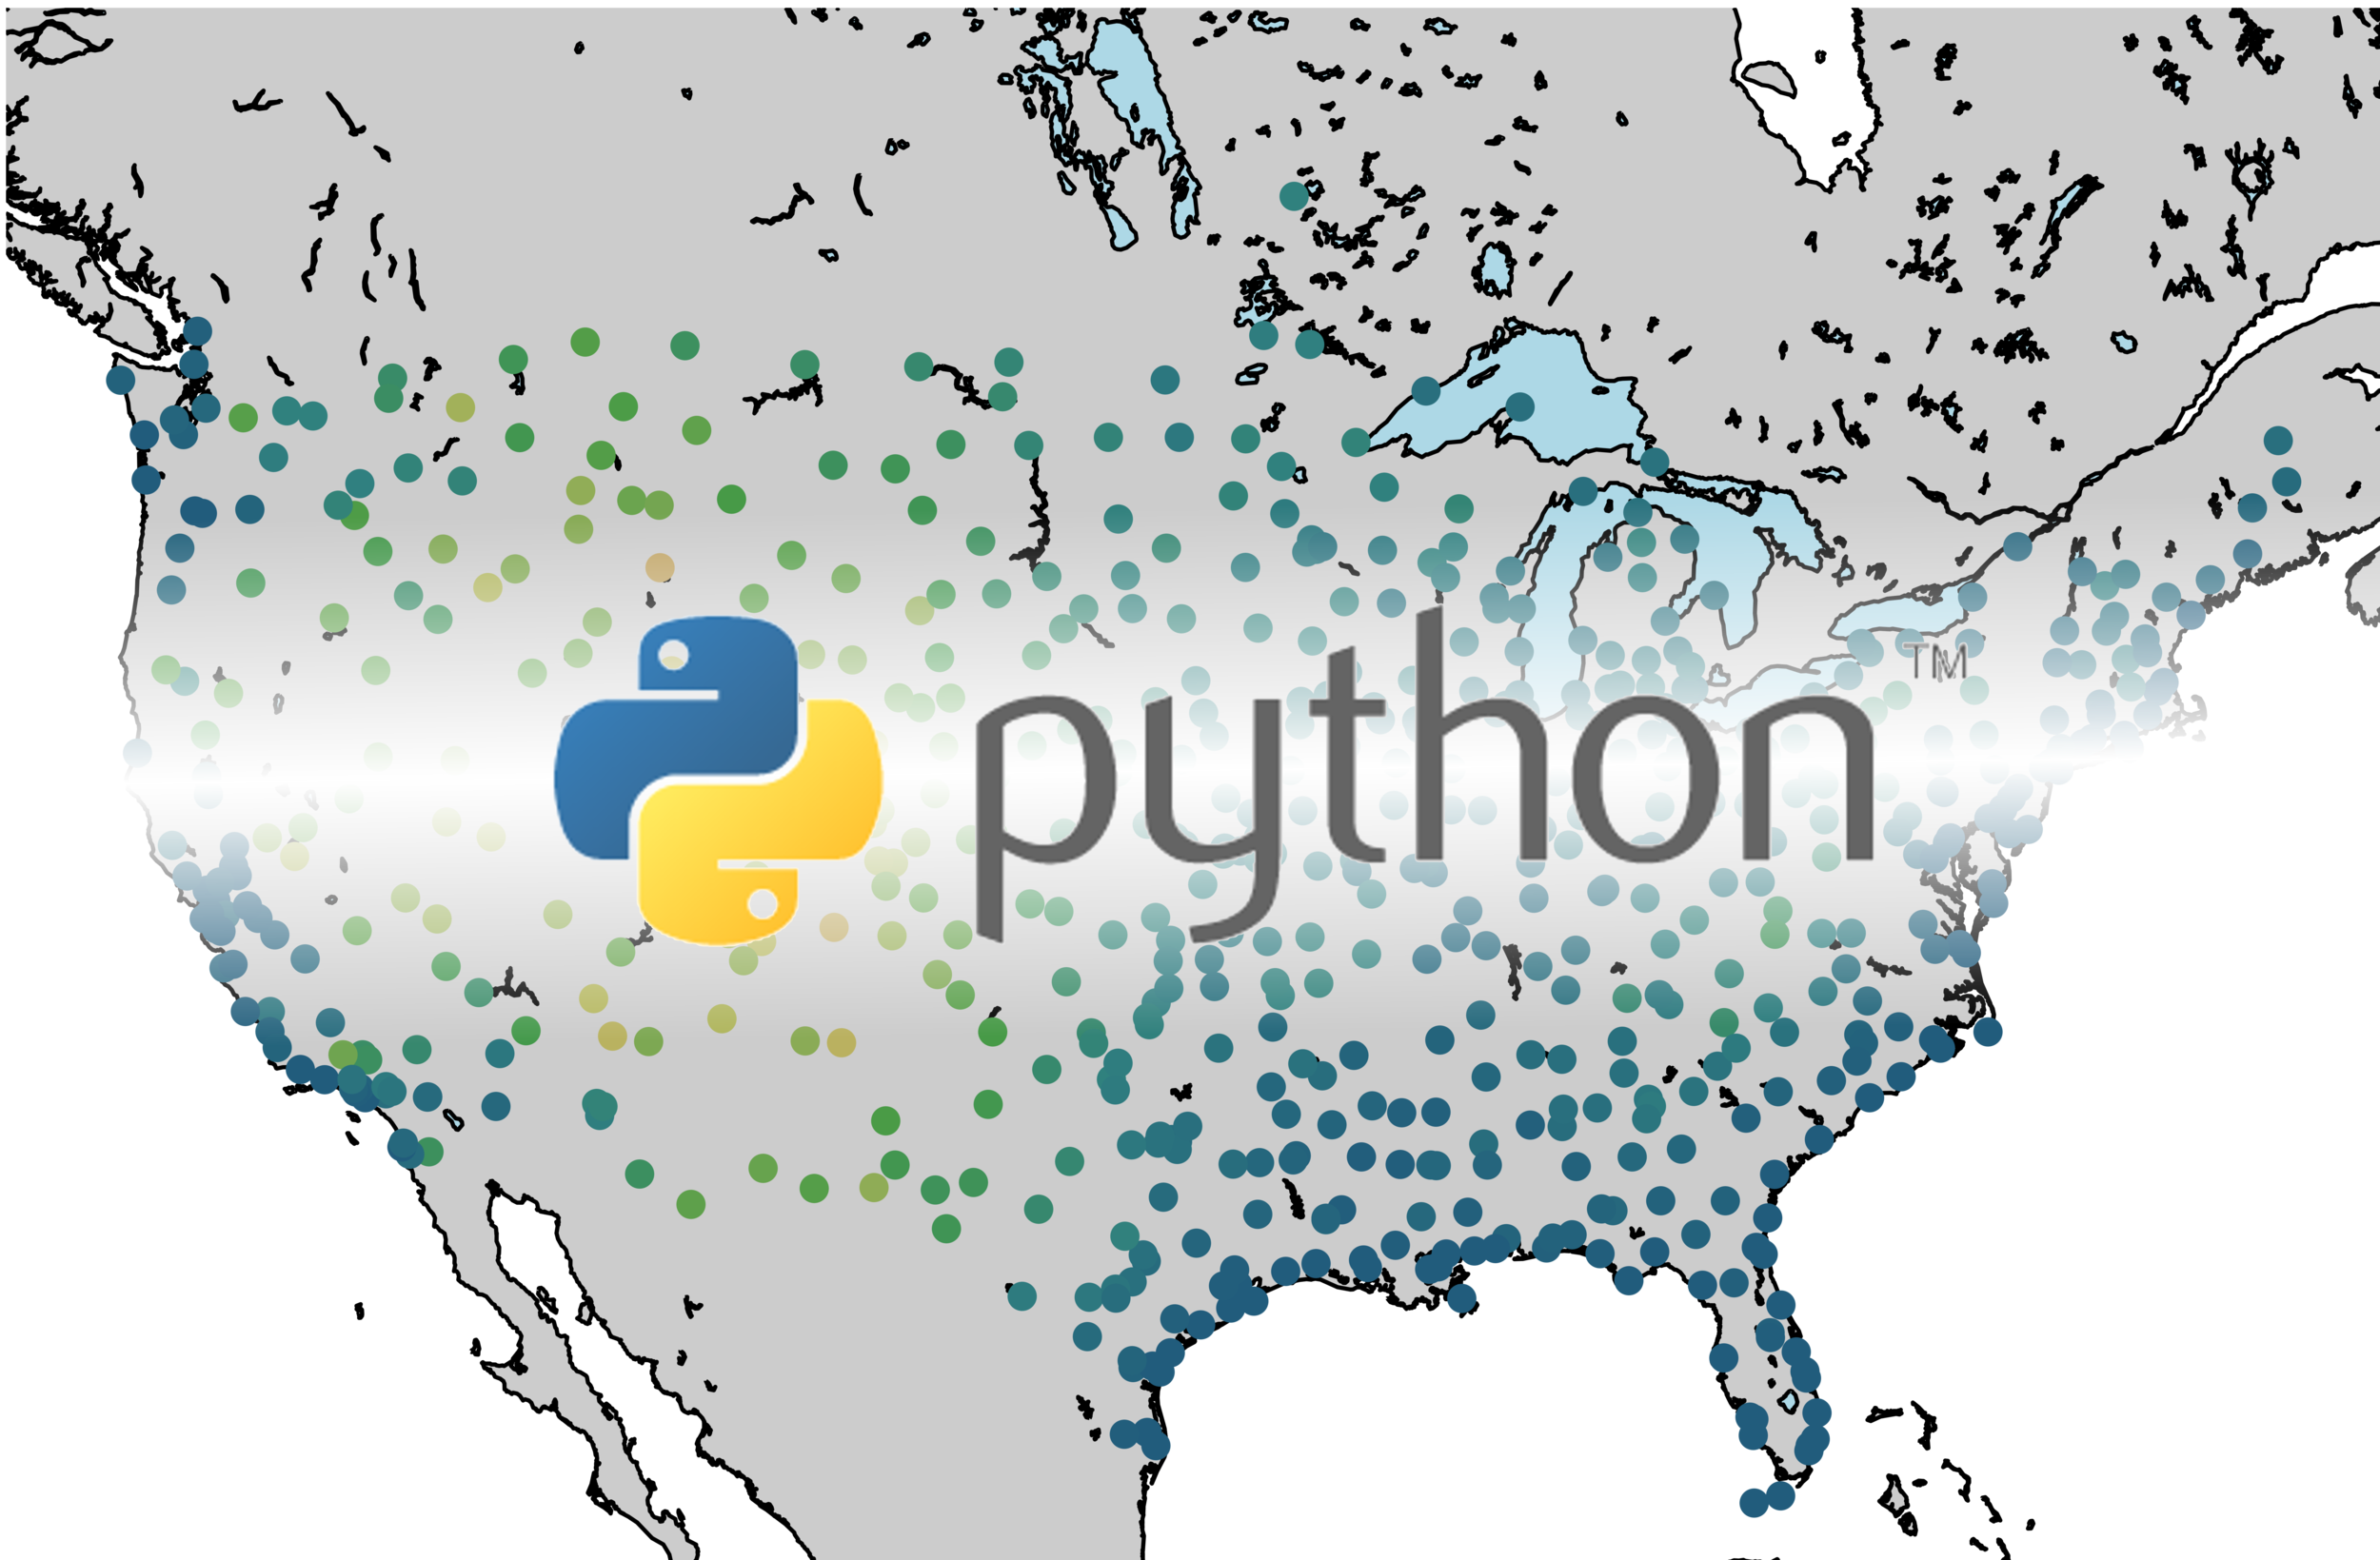
Geographic Visualizations in Python with Cartopy
Cartopy is a cartographic Python library that was developed for applications in geographic data manipulation and visualization. It is the successor to the the Basemap Toolkit, which was the previous Python library used for geographic visualizations. Cartopy can be used to plot satellite data atop realistic maps, visualize city and country boundaries, track and predict movement based on geographic targeting, and a range of other applications relating to geographic-encoded data systems. In this tutorial, Anaconda 3 will be used to install Cartopy and related geographic libraries. As an introduction to the library and geographic visualizations, some simple tests will be conducted to ensure that the Cartopy library was successfully installed and is working properly. In subsequent tutorials: shapefiles will be used as boundaries, realistic city streets will be mapped, and satellite data will be analyzed.
Python FTP for Data Mining and Analysis
Python’s file transfer protocol (FTP) library is used to parse weather station data from the publicly available automated surface observing system (ASOS) from the U.S.A.’s National Climatic Data Center (NCDC). Several programmatic tools available in Python are used to automate the parsing of weather data, as well as visualizing the resulting data.
Image Processing with Raspberry Pi and Python
The Raspberry Pi has a dedicated camera input port that allows users to record HD video and high-resolution photos. Using Python and specific libraries written for the Pi, users can create tools that take photos and video, and analyze them in real-time or save them for later processing. In this tutorial, I will use the 5MP picamera v1.3 to take photos and analyze them with Python and an Pi Zero W. This creates a self-contained system that could work as an item identification tool, security system, or other image processing application. The goal is to establish the basics of recording video and images onto the Pi, and using Python and statistics to analyze those images.

Raspberry Pi Vibration Analysis Experiment With a Free-Free Bar
Using the Euler-Bernoulli beam theory, the resonant frequencies of a beam will be measured using a thin film piezoelectric transducer and compared to the theoretical calculations. A Raspberry Pi will be used along with a high-frequency data acquisition system (Behringer UCA202, sample rate: 44.1kHz) and the Python programming language for analysis. The fast fourier transform will allow us to translate the subtle beam deflections into meaningful frequency content. This tutorial is meant to introduce Python and Raspberry Pi as formidable tools for vibration analysis by using measurements as validation against theory.

Loudspeaker Analysis and Experiments: Part II
Part II of the tutorial series on loudspeaker analysis and experiments. The majority of this entry focuses on finding Thiele-Small parameters to fully characterize an electrodynamic loudspeaker in free air.
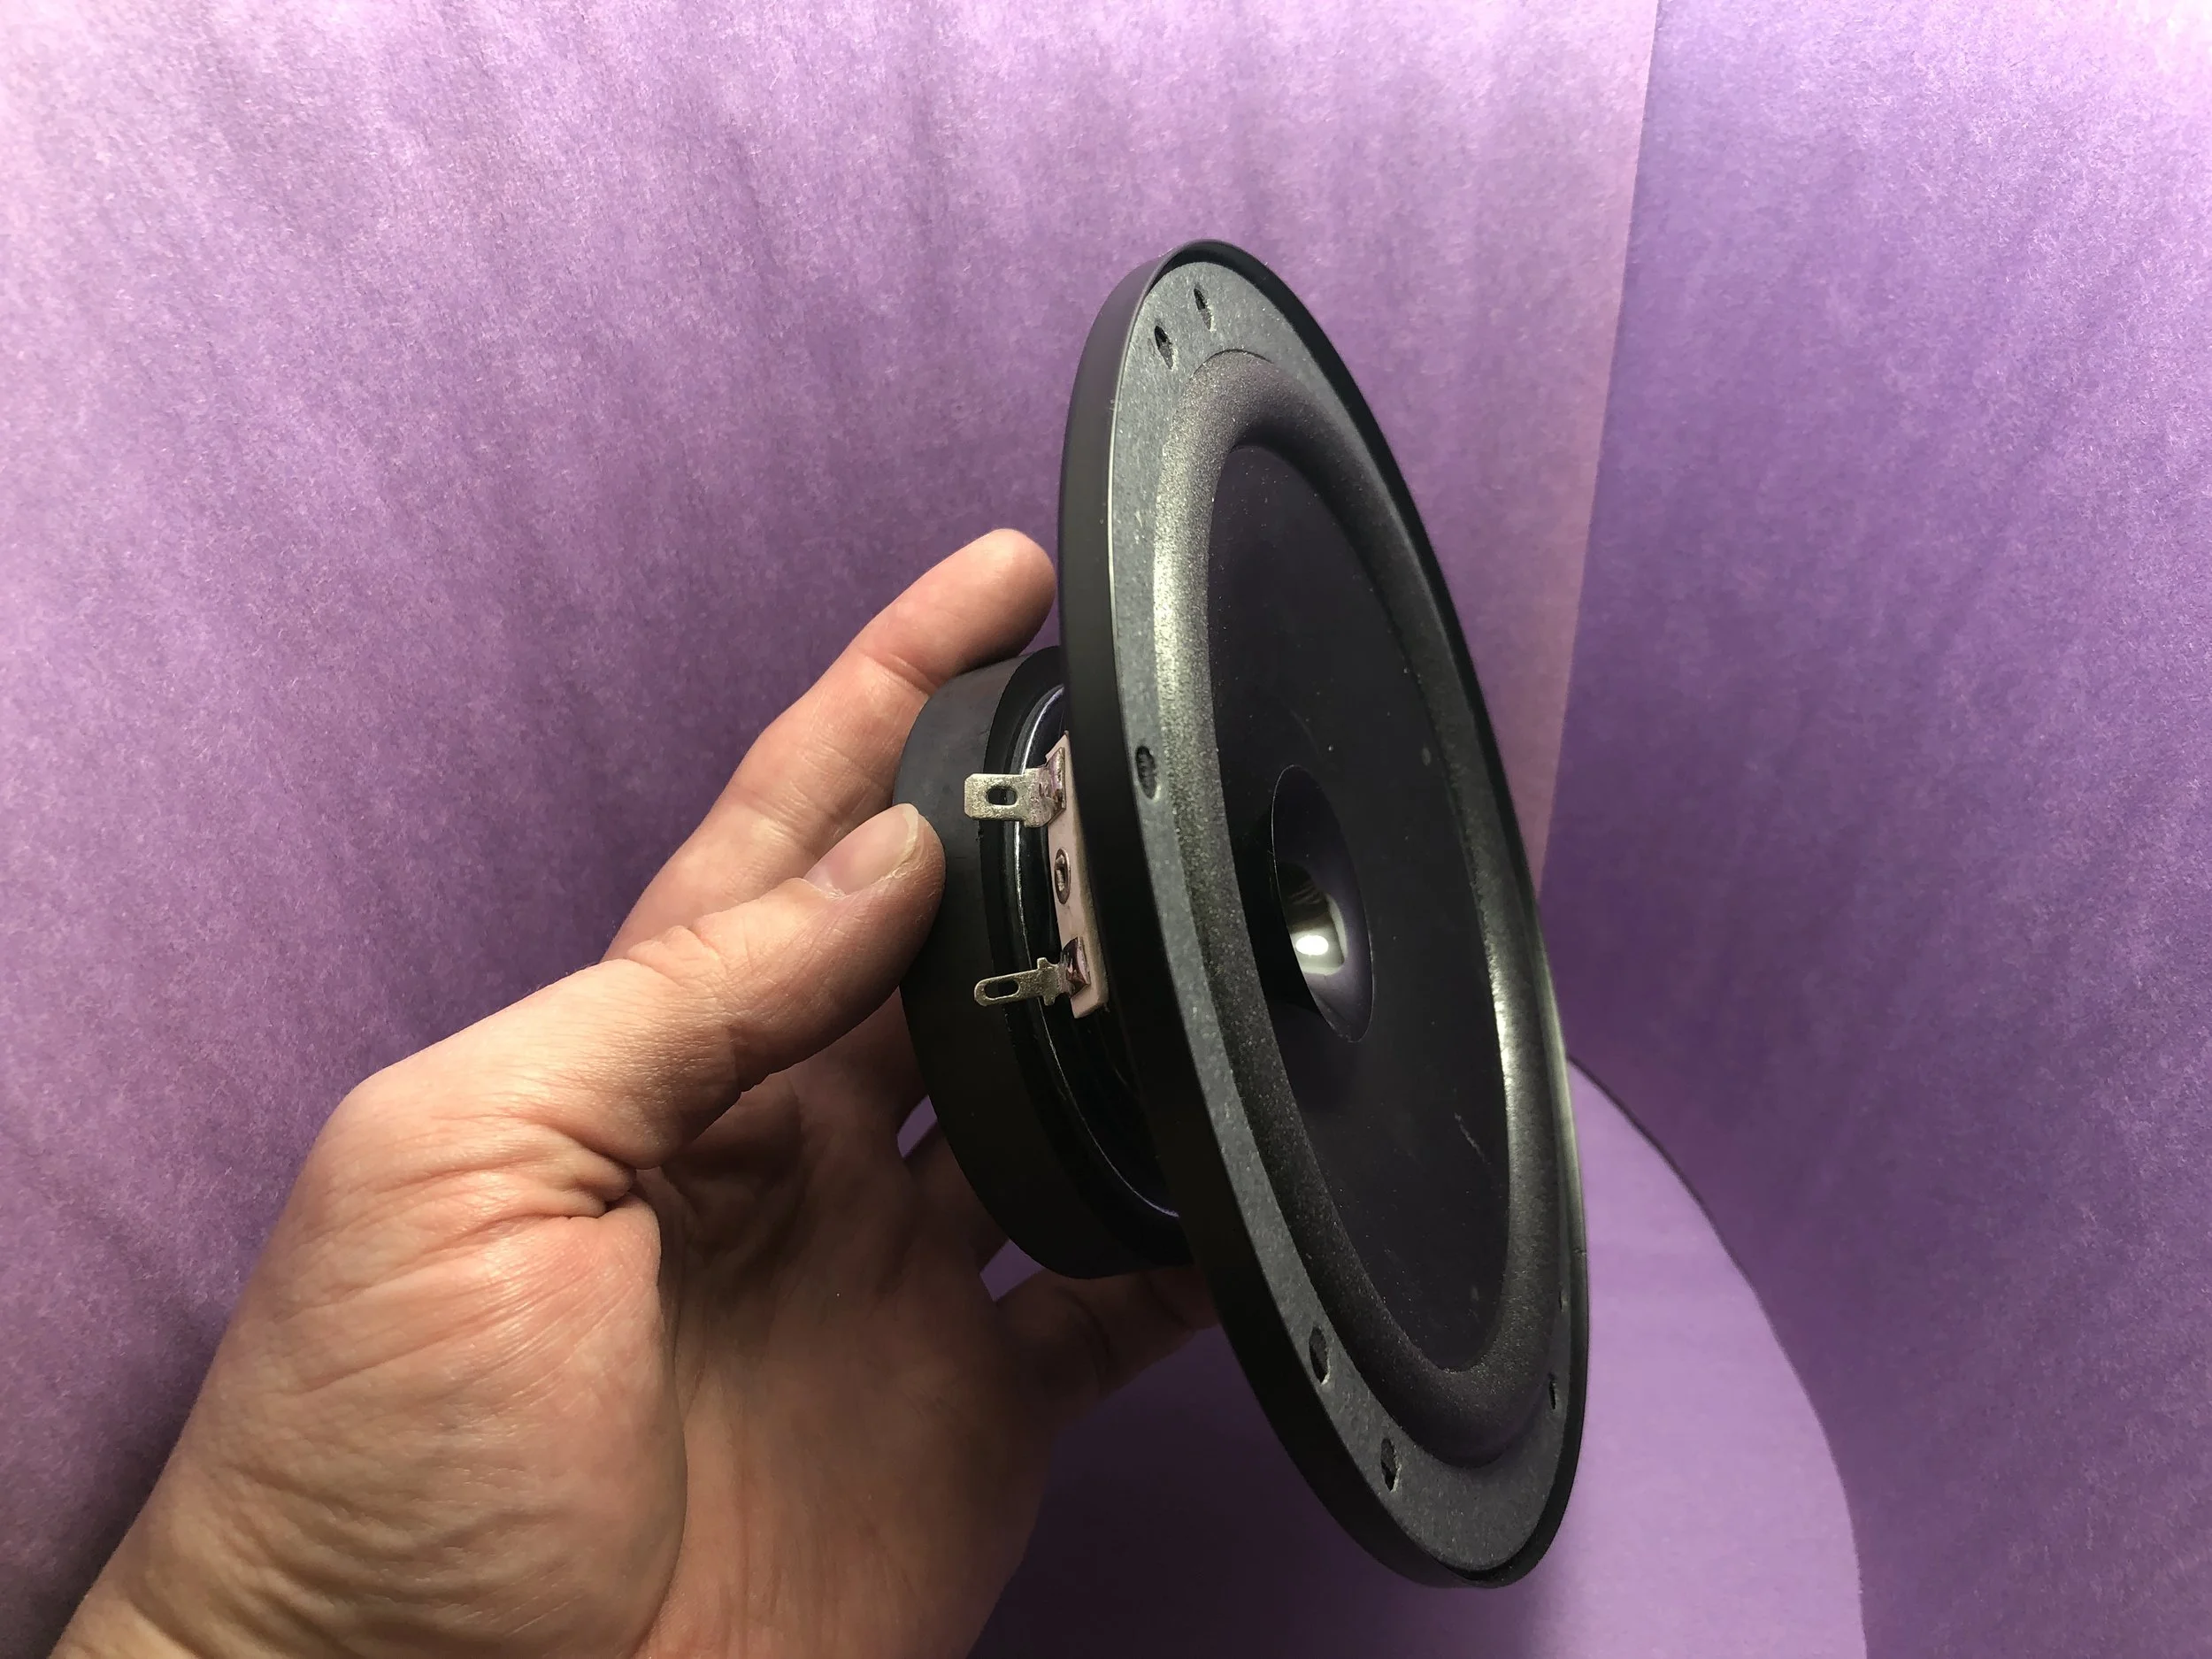
Loudspeaker Analysis and Experiments: Part I
In this tutorial, a loudspeaker will be analyzed by calculating the Thiele-Small parameters from impedance measurements using an inexpensive USB data acquisition system (minimum sampling rate of 44.1 kHz). The methods used in this project will educate the user on multiple engineering topics ranging from: data acquisition, electronics, acoustics, signal processing, and computer programming.