Portable GPS Tracker with Arduino
In the past, we explored the NEO-6M GPS module with Arduino through a few of our tutorials (see: "Comparing iPhone GPS Against NEO-6M with Arduino" and "Arduino GPS Tracker"). In this tutorial, we wanted to push the size limits of the portable GPS tracker by using a mini GPS module called the ATGM336H. The result is a pocket-sized GPS tracker with the low-profile by pairing the ATGM336H module with an Arduino Xiao microcontroller, SD Card Module, and 3.7V LiPo Battery. The prototype developed here will be an autonomous tracker that will record latitude/longitude at roughly 1-10 points per second (1Hz - 10Hz) and needs no external components to track geolocation. The prototype can fit in a users pocket and can track for several hours. We will also present a Python program that will plot the geolocation data points that the user can use to view the route tracked by the Arduino GPS datalogger system. The Python analysis demonstrates how well the ATGM336H GPS module and antenna are able to replicate the walking path of a human with great resolution and accuracy.

Geographic Visualizations in Python with Cartopy
Cartopy is a cartographic Python library that was developed for applications in geographic data manipulation and visualization. It is the successor to the the Basemap Toolkit, which was the previous Python library used for geographic visualizations. Cartopy can be used to plot satellite data atop realistic maps, visualize city and country boundaries, track and predict movement based on geographic targeting, and a range of other applications relating to geographic-encoded data systems. In this tutorial, Anaconda 3 will be used to install Cartopy and related geographic libraries. As an introduction to the library and geographic visualizations, some simple tests will be conducted to ensure that the Cartopy library was successfully installed and is working properly. In subsequent tutorials: shapefiles will be used as boundaries, realistic city streets will be mapped, and satellite data will be analyzed.
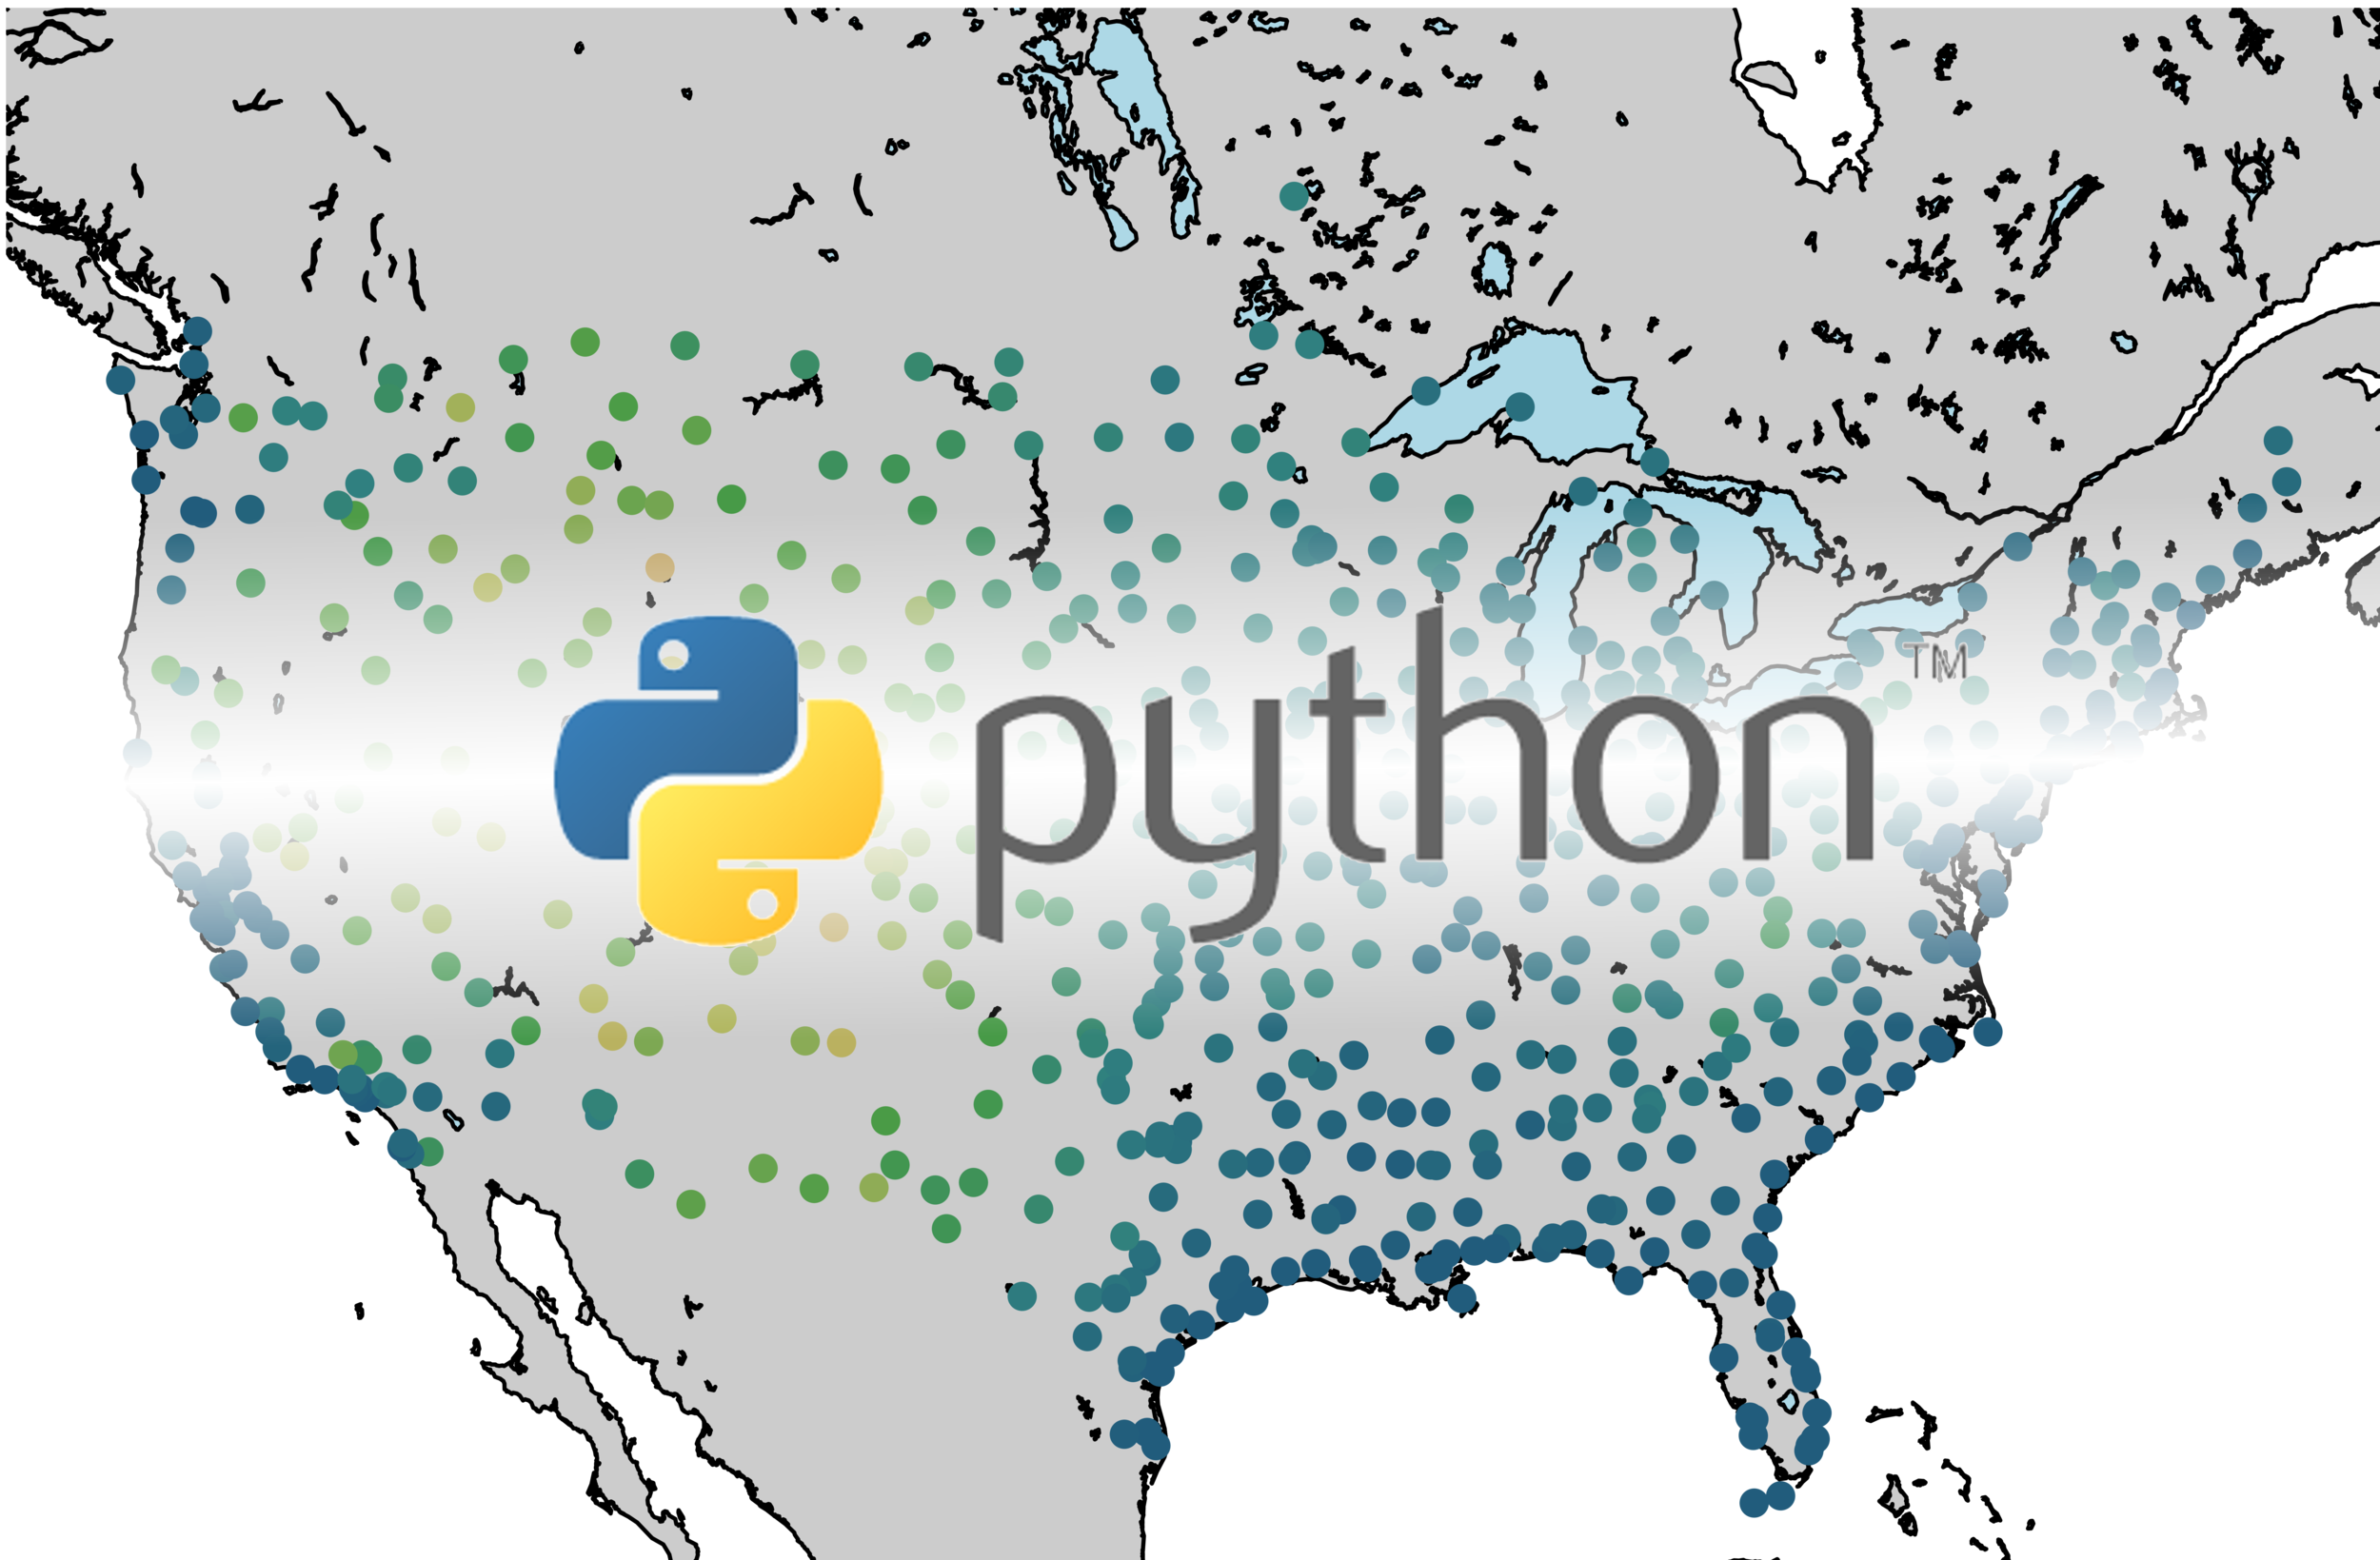
Python FTP for Data Mining and Analysis
Python’s file transfer protocol (FTP) library is used to parse weather station data from the publicly available automated surface observing system (ASOS) from the U.S.A.’s National Climatic Data Center (NCDC). Several programmatic tools available in Python are used to automate the parsing of weather data, as well as visualizing the resulting data.

Arduino GPS Tracker
The NEO-6 is a miniature GPS module designed by u-blox to receive updates from up to 22 satellite on 50 different channels that use trilateration to approximate fixed position of a receiver device every second (or less, for some modules). The particular module used in this tutorial, the NEO-6M, is capable of updating its position every second and communicates with an Arduino board using UART serial communication. The NEO-6M uses the National Marine Electronics Association (NMEA) protocol which provides temporal and geolocation information such as Greenwich Mean Time (GMT), latitude, longitude, altitude, and approximate course speed. The NEO-6M and Arduino board will also be paired with an SD module to create a portable logger that acts as a retrievable GPS tracker.

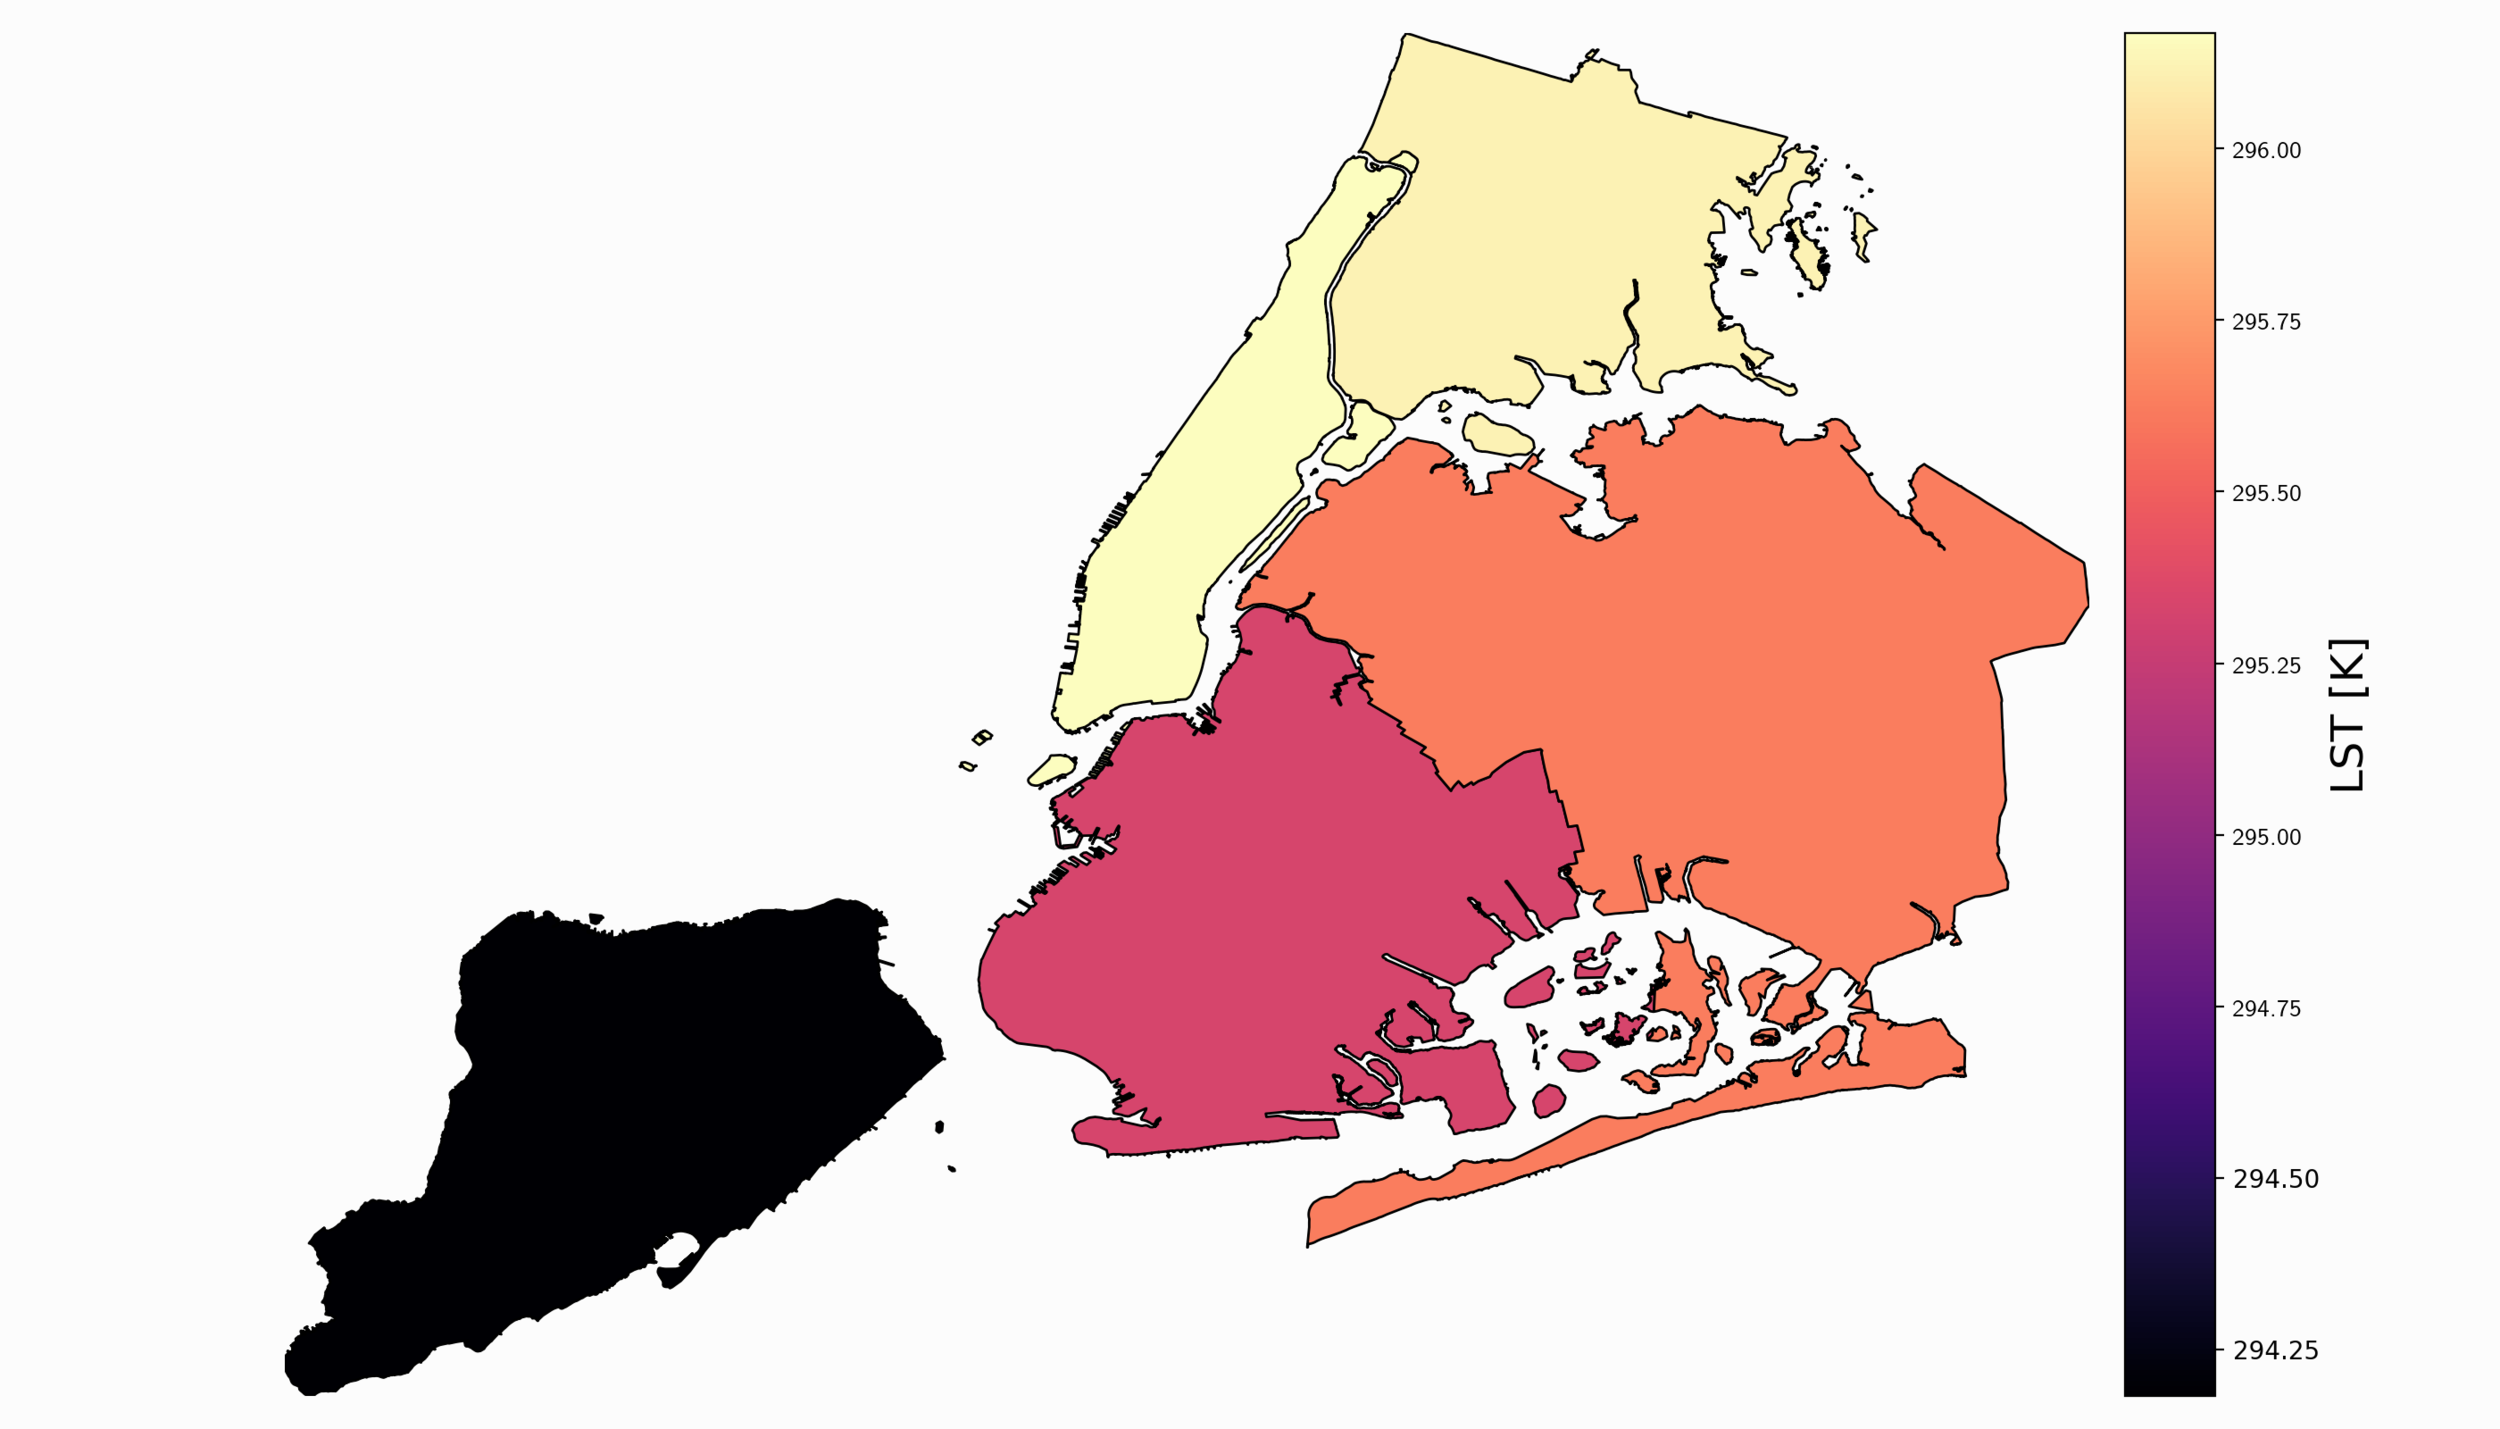
Satellite Imagery Analysis in Python Part III: Land Surface Temperature and The National Land Cover Database (NLCD)
The third entry of the satellite imagery analysis in Python uses land surface temperature (LST) as the data variable along with land cover information from the national (U.S.) database. The land cover information will allow us to create a relationship between land cover type and its respective heating (or cooling) contribution to the earth’s surface. Land cover is used in many applications ranging from algorithm development to military applications and crop surveying, not to mention applications in water management and drought awareness.
Satellite Imagery Analysis in Python Part II: GOES-16 Land Surface Temperature (LST) Manipulation
For part II, the focus shifts from the introduction of file formats and libraries to the geospatial analysis of satellite images. Python will again be used, along with many of its libraries. Land Surface Temperature will again be used as the data information, along with shapefiles used for geometric boundary setting, as well as information about buildings and land cover produced by local governments - all of which are used in meteorological and weather research and analyses.

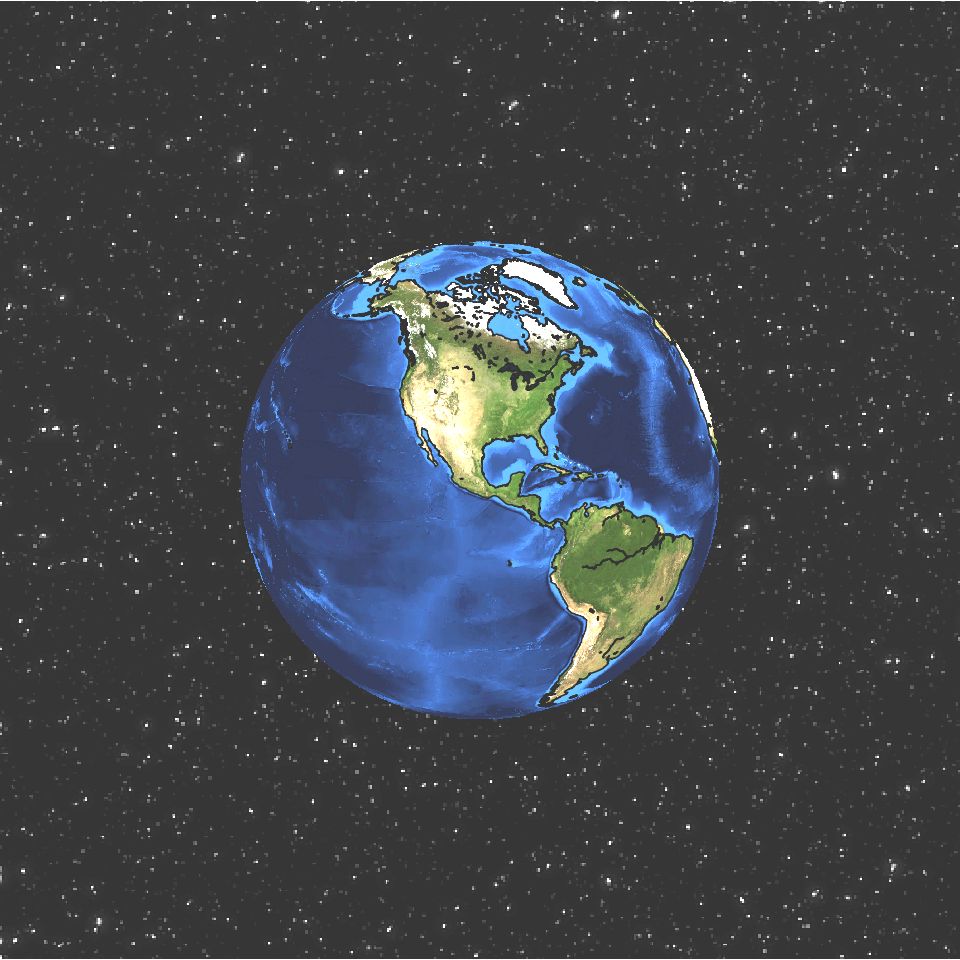
Satellite Imagery Analysis in Python Part I: GOES-16 Data, netCDF Files, and The Basemap Toolkit
In this tutorial series, Python’s Basemap toolkit and several other libraries are utilized to explore the publicly-available Geostationary Operational Environmental Satellite-16 (GOES-16). In this first entry, the following will be introduced: acquisition of satellite data, understanding of satellite data files, mapping of geographic information in Python, and plotting satellite land surface temperature (LST) on a map.


Geospatial Analysis Using QGIS and Open-Source Data
Geographic information systems (GIS) are powerful tools used by climatologists, health organizations, defense agencies, real-estate companies, and nearly all professions that rely on location-based data. Geographic data is often very cumbersome to analyze traditionally, which is why visualization tools are essential. Depending on the size and complexity of the data, several robust GIS softwares exist on the market from open-source (free) to paid subscriptions. Each software has its strengths and weaknesses, so depending on the application one software may be more effective than another. A few of the leading softwares are: GE Smallworld, Google Earth Pro, AutoCAD Map 3D, and Maptitude. QGIS is an open-source competitor to ArcGIS, which is arguably the industry leader in the GIS market, so for financial and ease-of-application reasons, QGIS is employed here. I will also cover four scales of geographic analysis: one at the city level (NYC), one at the state level (Washington State), one at the country level (U.S.A.), and one at the world level. The goal is to demonstrate the power and breadth of geographic information systems at any scale.