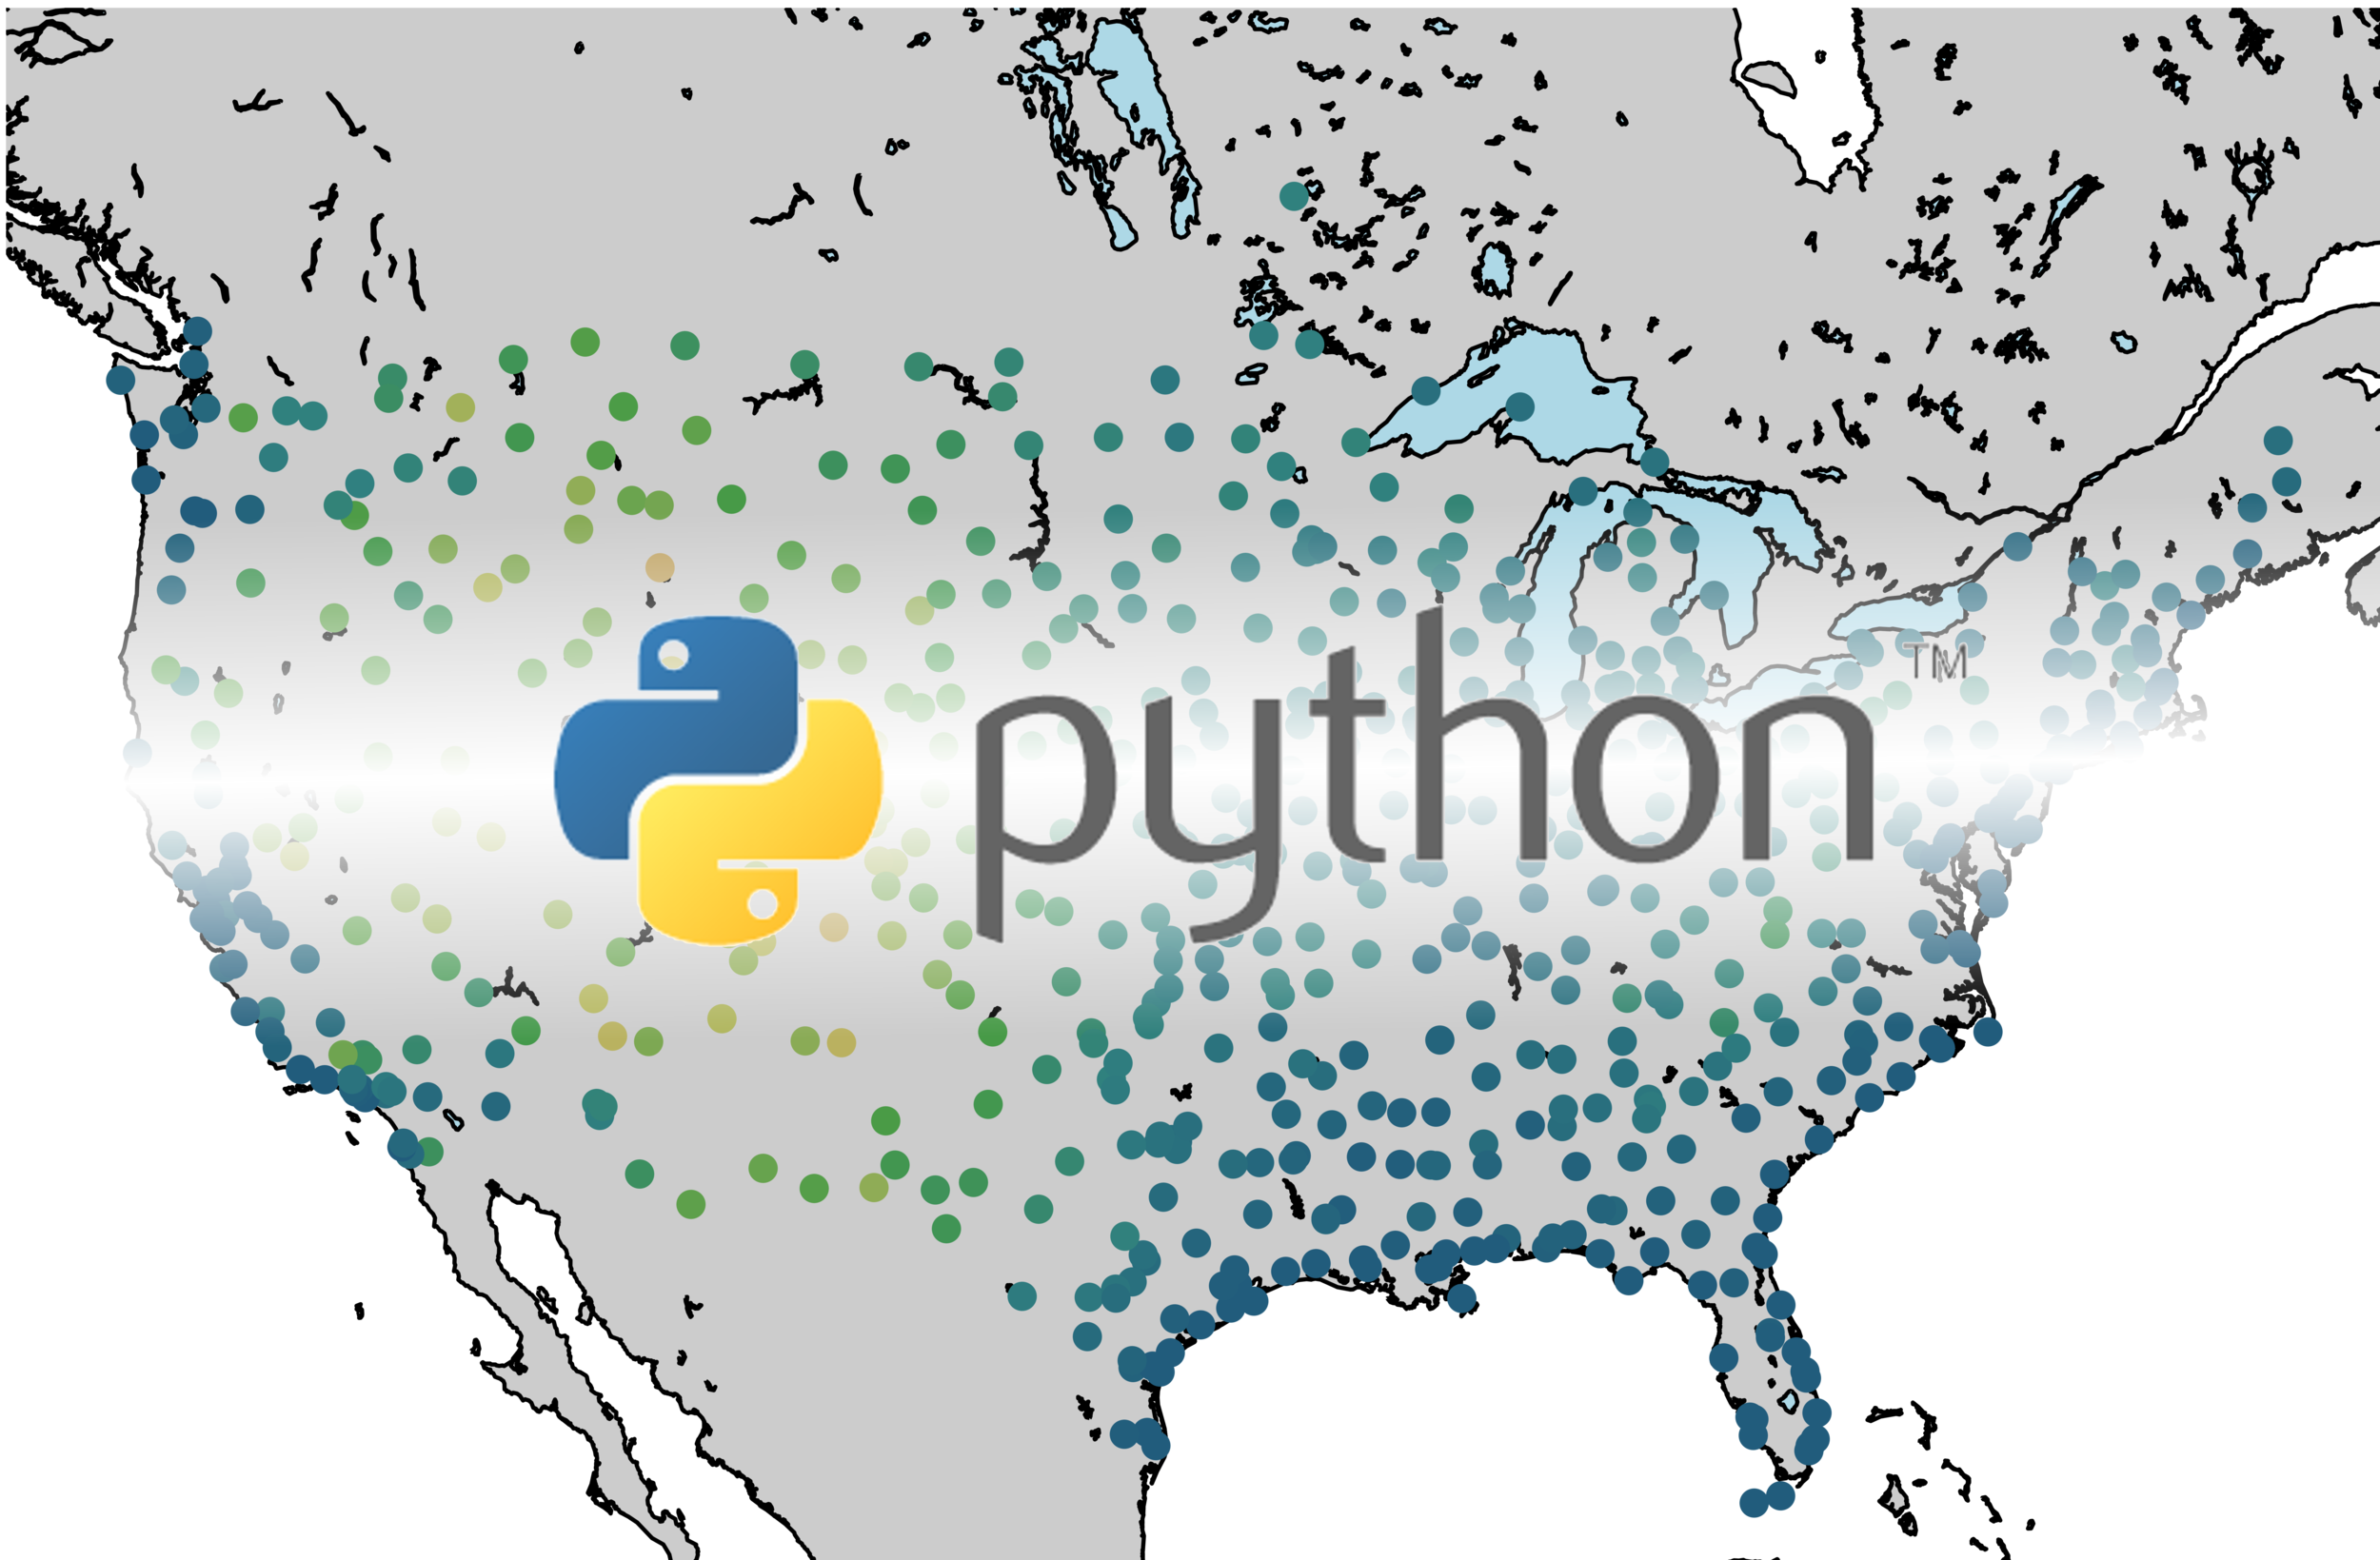
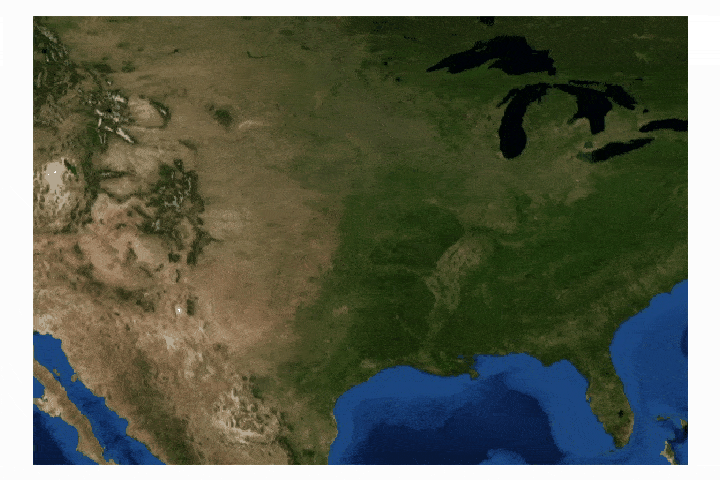
Geographic Visualizations in Python with Cartopy
Cartopy is a cartographic Python library that was developed for applications in geographic data manipulation and visualization. It is the successor to the the Basemap Toolkit, which was the previous Python library used for geographic visualizations. Cartopy can be used to plot satellite data atop realistic maps, visualize city and country boundaries, track and predict movement based on geographic targeting, and a range of other applications relating to geographic-encoded data systems. In this tutorial, Anaconda 3 will be used to install Cartopy and related geographic libraries. As an introduction to the library and geographic visualizations, some simple tests will be conducted to ensure that the Cartopy library was successfully installed and is working properly. In subsequent tutorials: shapefiles will be used as boundaries, realistic city streets will be mapped, and satellite data will be analyzed.

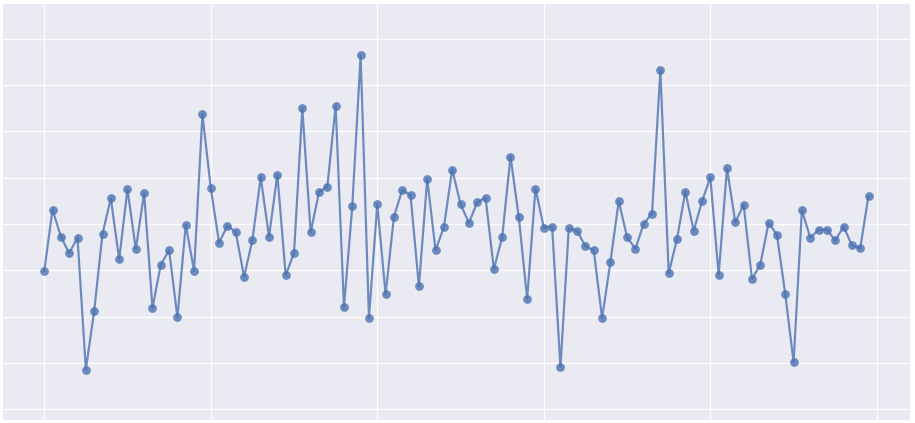
Google Trends x Yahoo Finance Analysis in Python
Python has a multitude of libraries dedicated to scraping the internet in various ways. For example, Google Trends is a product produced by Google that analyzes search history and publishes the popularity of search terms over time. One user created an algorithm to pull trend data from Google using Python in a package called pytrends. Another such library uses Python to pull stock information from Yahoo Stocks in a package called yfinance. Both of these libraries will be used to plot and compare finance and trend data over time using Python scripts. The methods outlined in this tutorial could be applied to areas in finance, data analytics, and data visualization in general.
Python FTP for Data Mining and Analysis
Python’s file transfer protocol (FTP) library is used to parse weather station data from the publicly available automated surface observing system (ASOS) from the U.S.A.’s National Climatic Data Center (NCDC). Several programmatic tools available in Python are used to automate the parsing of weather data, as well as visualizing the resulting data.
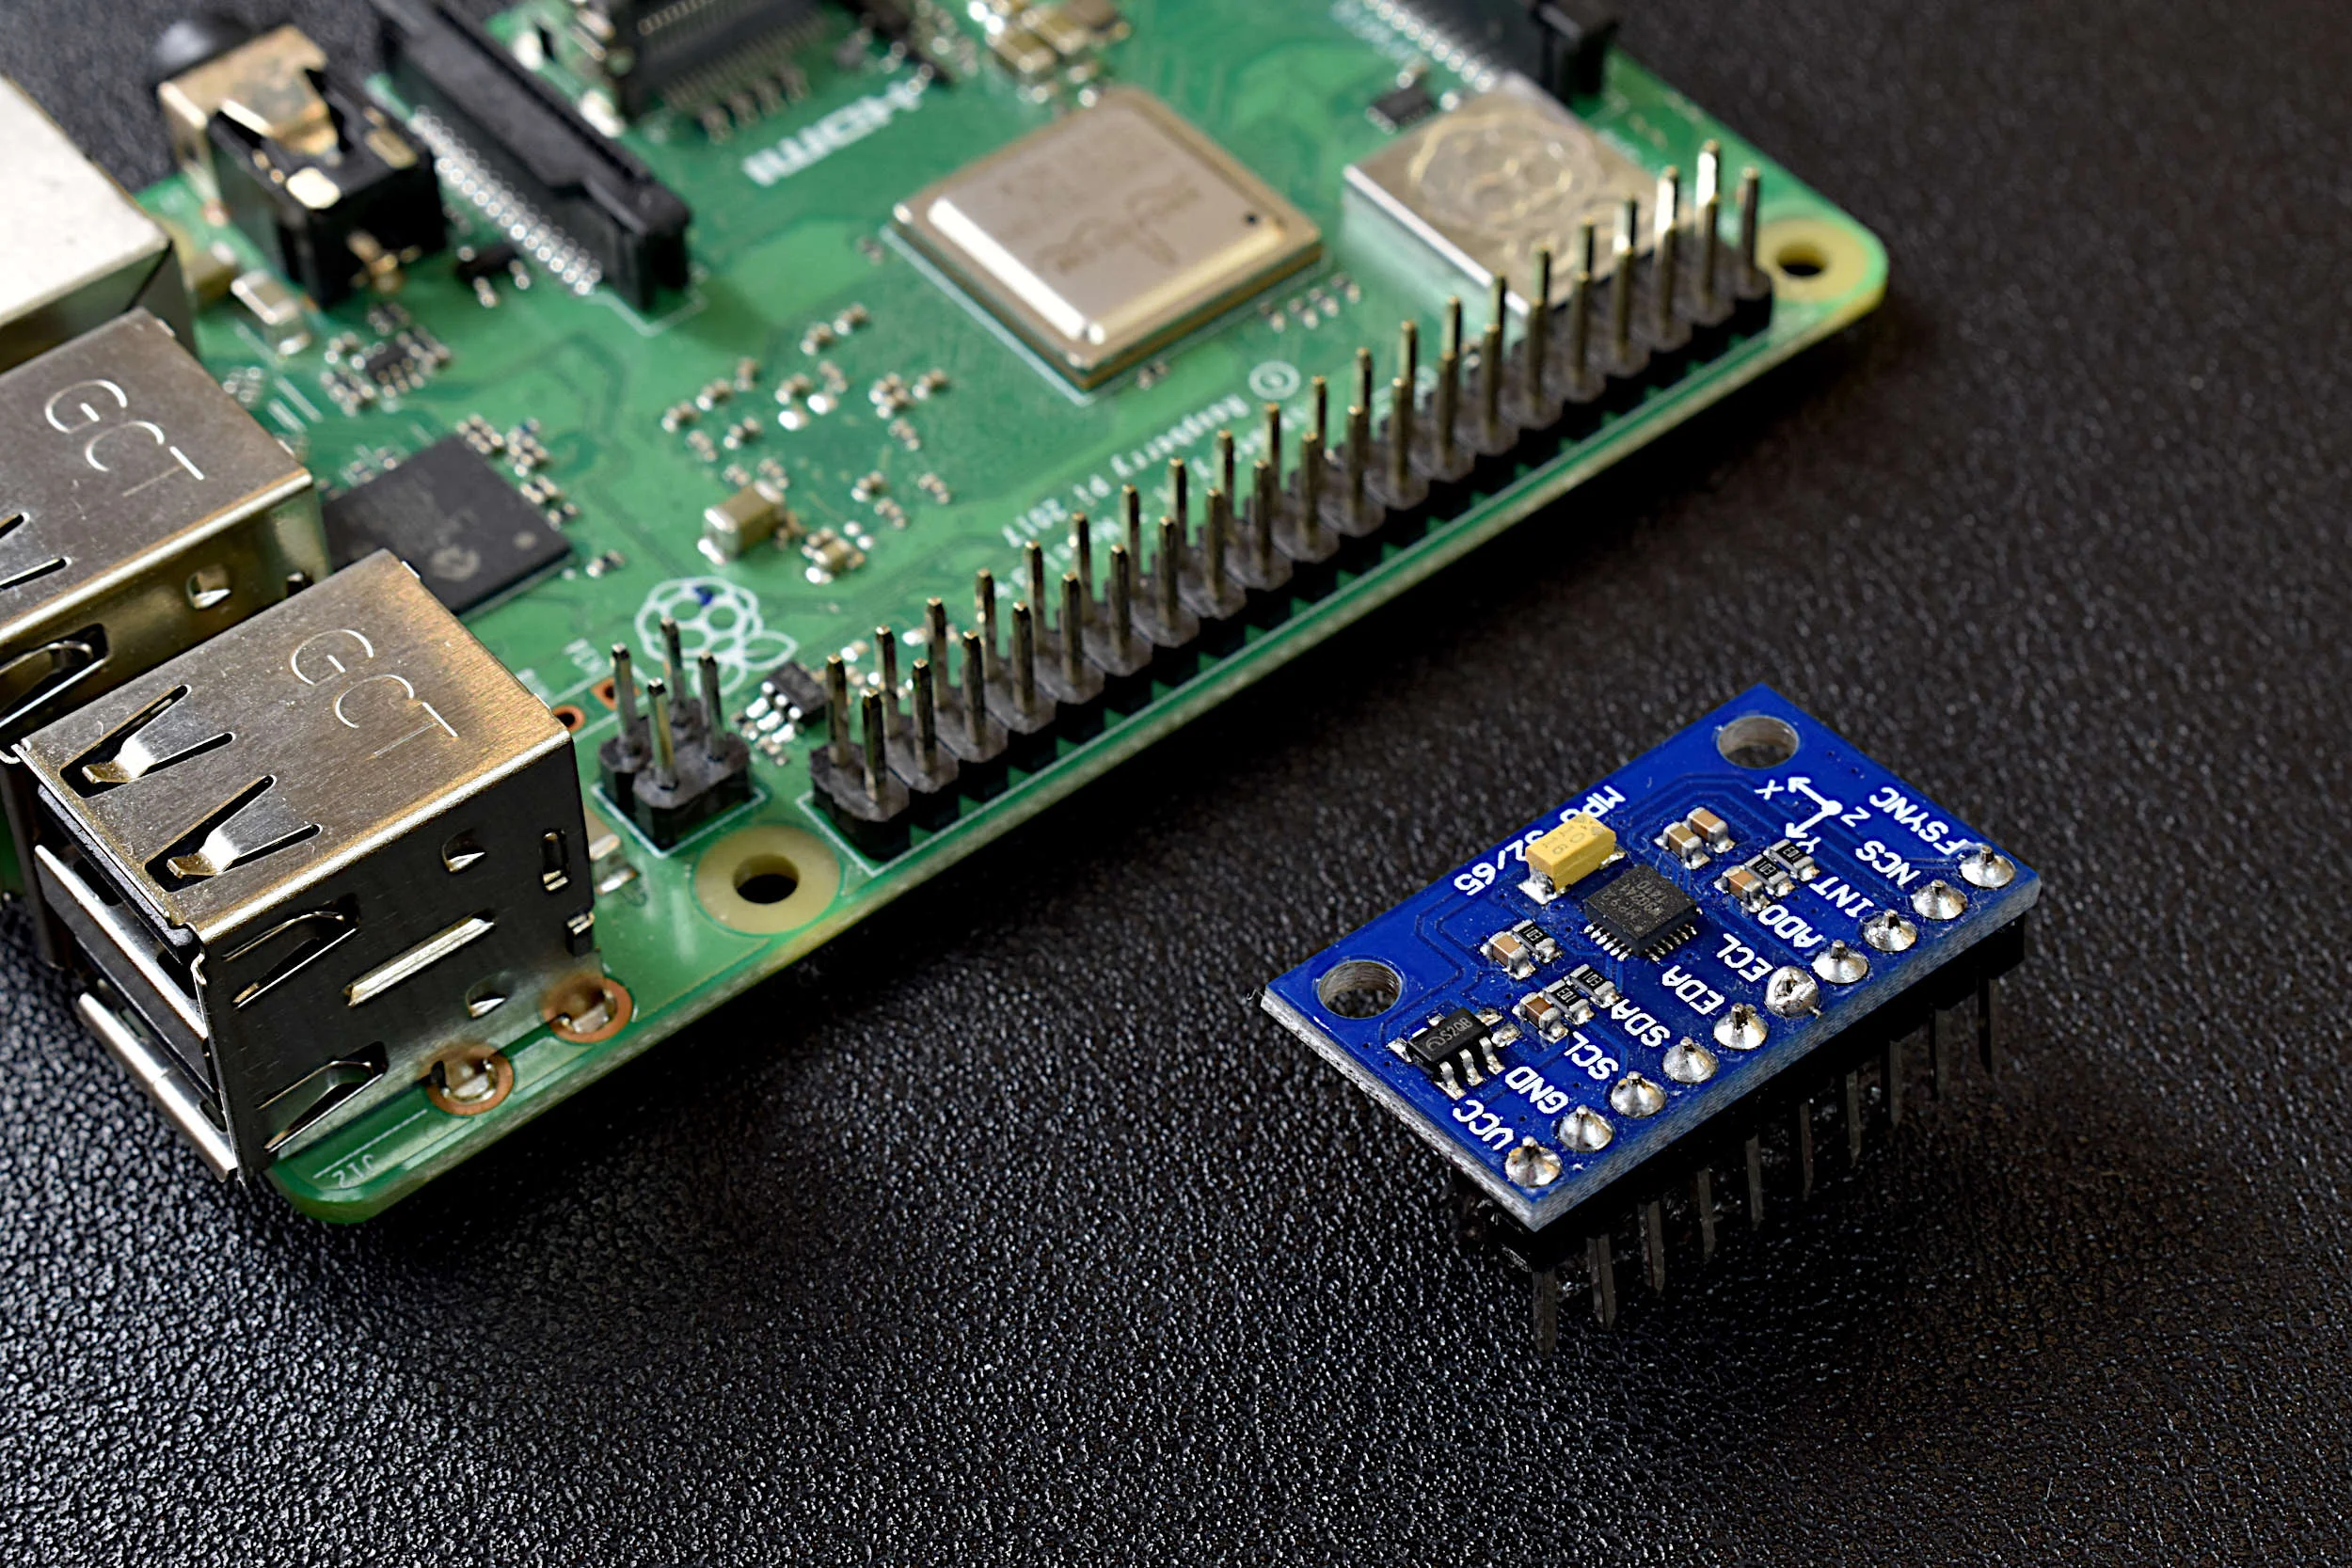
Accelerometer, Gyroscope, and Magnetometer Analysis with Raspberry Pi Part I: Basic Readings
A Raspberry Pi will be used to read the MPU9250 3-axis acceleration, 3-axis angular rotation speed, and 3-axis magnetic flux (MPU9250 product page can be found here). The output and limitations of the MPU9250 will be explored, which will help define the limitations of applications for each sensor. This is only the first entry into the MPU9250 IMU series, where in the breadth of the articles we will apply advanced techniques in Python to analyze each of the 9-axes of the IMU and develop real-world applications for the sensor, which may be useful to engineers interested in vibration analysis, navigation, vehicle control, and many other areas.