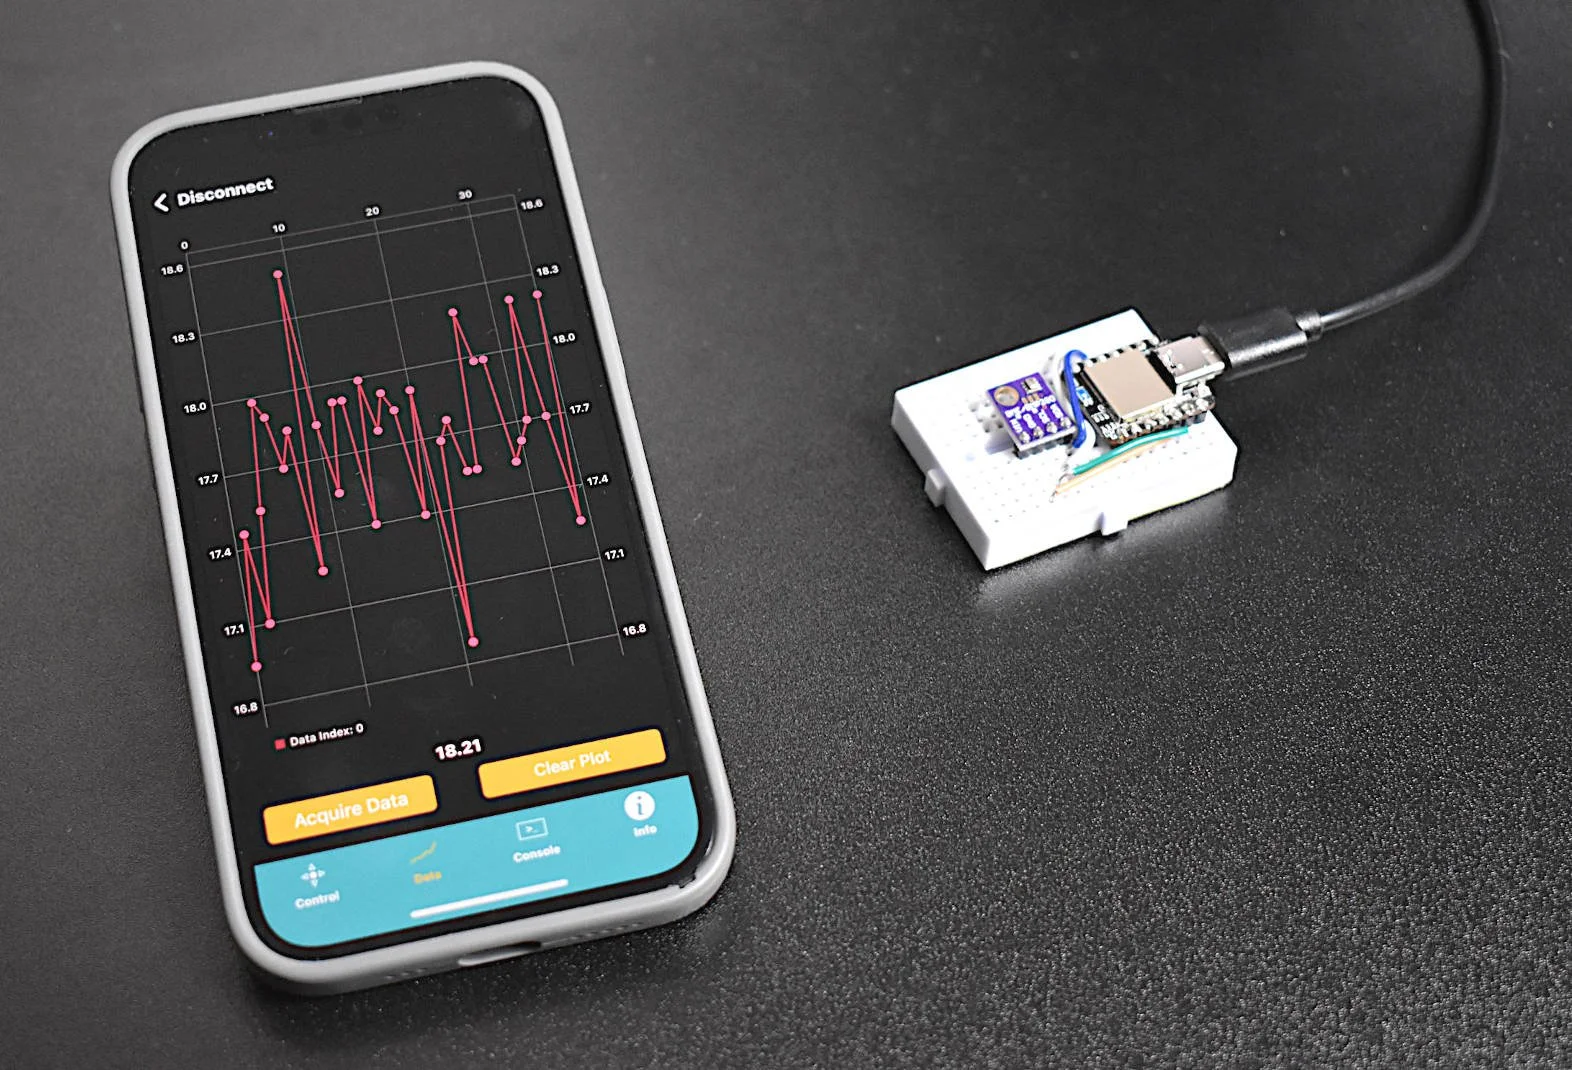
Arduino Sensor Data Logging and Visualization on iPhone
This is the second entry into the tutorial series centered around the MakerBLE Arduino board. Using the BLExAR iOS app again, we are able to monitor the incoming data from the MakerBLE board, plot the values, and save them to a comma-separated value (CSV) file. The data being sent is read from a BMP280 sensor over the I2C port by the MakerBLE board. Temperature, atmospheric pressure, and approximate altitude were all sent over the BLE connection with an iPhone.

Geographic Visualizations in Python with Cartopy
Cartopy is a cartographic Python library that was developed for applications in geographic data manipulation and visualization. It is the successor to the the Basemap Toolkit, which was the previous Python library used for geographic visualizations. Cartopy can be used to plot satellite data atop realistic maps, visualize city and country boundaries, track and predict movement based on geographic targeting, and a range of other applications relating to geographic-encoded data systems. In this tutorial, Anaconda 3 will be used to install Cartopy and related geographic libraries. As an introduction to the library and geographic visualizations, some simple tests will be conducted to ensure that the Cartopy library was successfully installed and is working properly. In subsequent tutorials: shapefiles will be used as boundaries, realistic city streets will be mapped, and satellite data will be analyzed.

Google Trends x Yahoo Finance Analysis in Python
Python has a multitude of libraries dedicated to scraping the internet in various ways. For example, Google Trends is a product produced by Google that analyzes search history and publishes the popularity of search terms over time. One user created an algorithm to pull trend data from Google using Python in a package called pytrends. Another such library uses Python to pull stock information from Yahoo Stocks in a package called yfinance. Both of these libraries will be used to plot and compare finance and trend data over time using Python scripts. The methods outlined in this tutorial could be applied to areas in finance, data analytics, and data visualization in general.

Arduino + VL53L1X Time of Flight Distance Measurement
Time of flight (ToF) is an approximation of the time it takes a traveling wave to come in contact with a surface and reflect back to the source. Time of flight has applications in automotive obstacle detection, resolving geographic surface composition, and computer vision and human gesture recognition. In the application here, the VL53L1X ToF sensor will be used to track the displacement of a ping pong ball falling down a tube. We can predict the acceleration and behavior of a falling ping pong ball by balancing the forces acting on the ball, and ultimately compare the theory to the actual displacement tracked by the time of flight sensor.
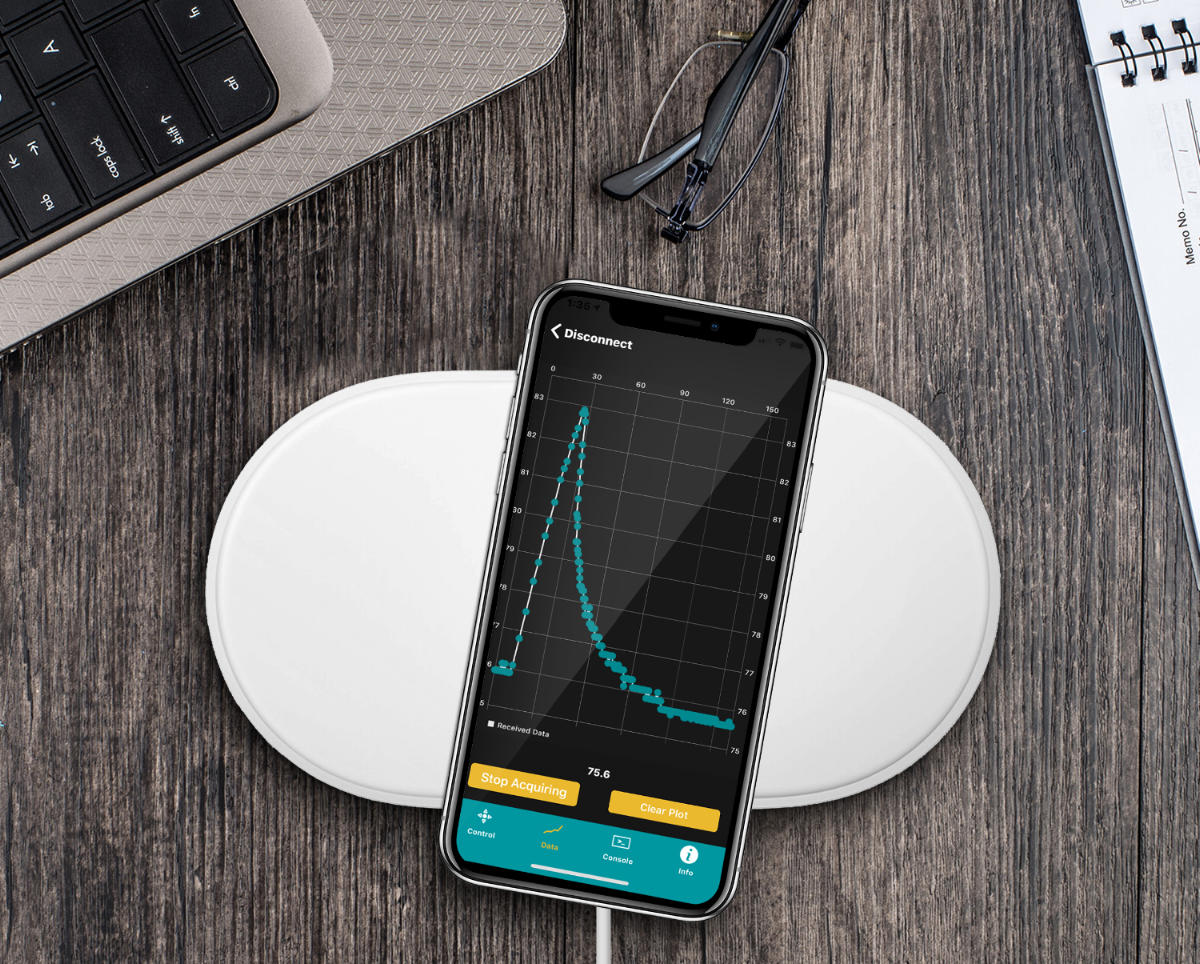
iPhone Datalogger with Arduino Using The iOS Bluetooth App BLExAR
The BLExAR app will be used in conjunction with a CC2541 (HM-10, JDY-08, AT-09, SH-M08) Bluetooth module and an Arduino (ATmega328) board to create a simple data acquisition system. A DHT22 sensor will provide temperature and humidity data to the Arduino which will be recorded by an iOS device via the BLExAR app. This experiment is a real-world example of an Arduino application demonstrating data acquisition from a real sensor. This tutorial will allow users to solve their own engineering problems using the modern Arduino platform and wireless communication through the BLExAr app, which will ultimately expand the reach and compatibility of technology in the classical sciences through exploration and experimentation.


Geospatial Analysis Using QGIS and Open-Source Data
Geographic information systems (GIS) are powerful tools used by climatologists, health organizations, defense agencies, real-estate companies, and nearly all professions that rely on location-based data. Geographic data is often very cumbersome to analyze traditionally, which is why visualization tools are essential. Depending on the size and complexity of the data, several robust GIS softwares exist on the market from open-source (free) to paid subscriptions. Each software has its strengths and weaknesses, so depending on the application one software may be more effective than another. A few of the leading softwares are: GE Smallworld, Google Earth Pro, AutoCAD Map 3D, and Maptitude. QGIS is an open-source competitor to ArcGIS, which is arguably the industry leader in the GIS market, so for financial and ease-of-application reasons, QGIS is employed here. I will also cover four scales of geographic analysis: one at the city level (NYC), one at the state level (Washington State), one at the country level (U.S.A.), and one at the world level. The goal is to demonstrate the power and breadth of geographic information systems at any scale.
