Geographic Visualizations in Python with Cartopy
Cartopy is a cartographic Python library that was developed for applications in geographic data manipulation and visualization. It is the successor to the the Basemap Toolkit, which was the previous Python library used for geographic visualizations. Cartopy can be used to plot satellite data atop realistic maps, visualize city and country boundaries, track and predict movement based on geographic targeting, and a range of other applications relating to geographic-encoded data systems. In this tutorial, Anaconda 3 will be used to install Cartopy and related geographic libraries. As an introduction to the library and geographic visualizations, some simple tests will be conducted to ensure that the Cartopy library was successfully installed and is working properly. In subsequent tutorials: shapefiles will be used as boundaries, realistic city streets will be mapped, and satellite data will be analyzed.

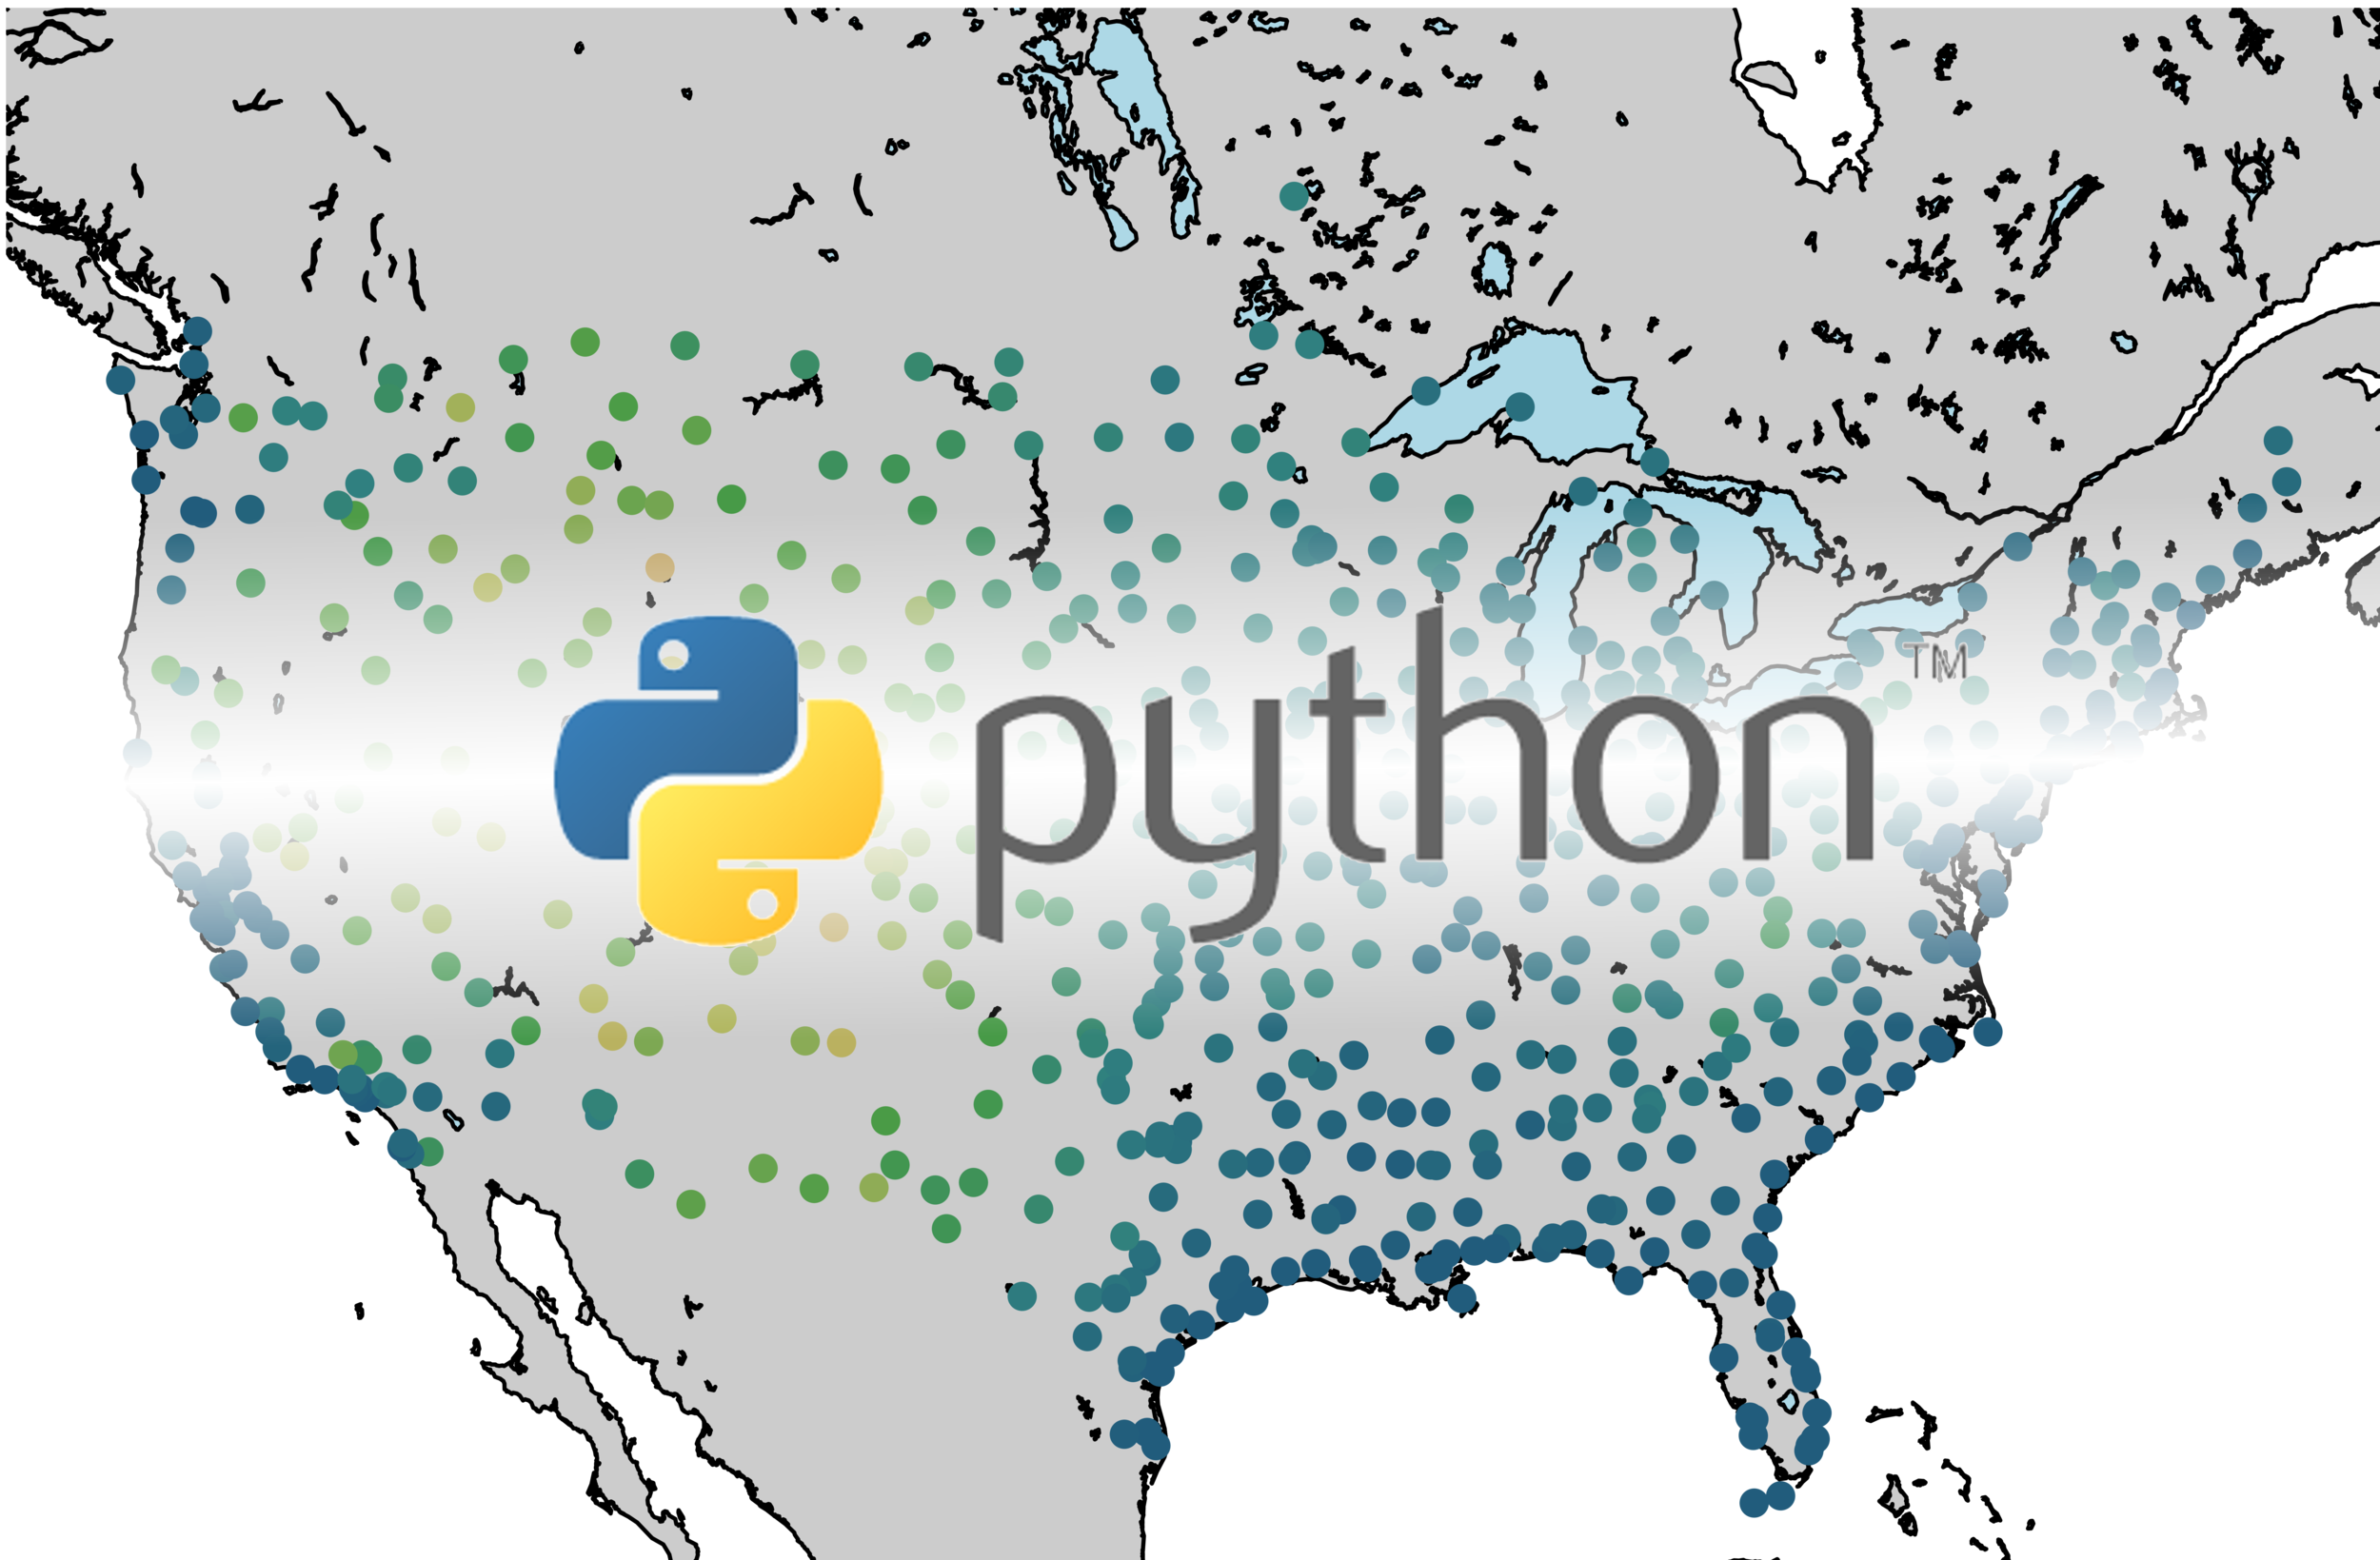
Visualizing COVID-19 Data in Python
This blog post is aimed at creating meaningful visualizations that may or may not be available elsewhere, while instructing users on how to source, analyze, and visualize COVID-19 infection case and rate data using Python. All of the data used herein is publicly available for anyone interested in replicating the figures, with code and links where necessary. The methods used here have been uniquely conceived and developed by Maker Portal, and in no way reflect preferred methods of either the government or any other private entities. Several Python toolboxes will be implemented below, and it is recommended that users install and verify their functionality before attempting to replicate the forthcoming figures.

Arduino GPS Tracker
The NEO-6 is a miniature GPS module designed by u-blox to receive updates from up to 22 satellite on 50 different channels that use trilateration to approximate fixed position of a receiver device every second (or less, for some modules). The particular module used in this tutorial, the NEO-6M, is capable of updating its position every second and communicates with an Arduino board using UART serial communication. The NEO-6M uses the National Marine Electronics Association (NMEA) protocol which provides temporal and geolocation information such as Greenwich Mean Time (GMT), latitude, longitude, altitude, and approximate course speed. The NEO-6M and Arduino board will also be paired with an SD module to create a portable logger that acts as a retrievable GPS tracker.

Satellite Imagery Analysis in Python Part III: Land Surface Temperature and The National Land Cover Database (NLCD)
The third entry of the satellite imagery analysis in Python uses land surface temperature (LST) as the data variable along with land cover information from the national (U.S.) database. The land cover information will allow us to create a relationship between land cover type and its respective heating (or cooling) contribution to the earth’s surface. Land cover is used in many applications ranging from algorithm development to military applications and crop surveying, not to mention applications in water management and drought awareness.

Satellite Imagery Analysis in Python Part I: GOES-16 Data, netCDF Files, and The Basemap Toolkit
In this tutorial series, Python’s Basemap toolkit and several other libraries are utilized to explore the publicly-available Geostationary Operational Environmental Satellite-16 (GOES-16). In this first entry, the following will be introduced: acquisition of satellite data, understanding of satellite data files, mapping of geographic information in Python, and plotting satellite land surface temperature (LST) on a map.
GOES-R Satellite Latitude and Longitude Grid Projection Algorithm
Calculating latitude and longitude from a GOES-R L1b data file. The GOES-R L1b radiance files contain radiance data and geometry scan information in radians. This information is not enough to plot geographic radiance data right from the file, however, after some geometric manipulation harnessing satellite position and ellipsoid parameters, we can derive latitude and longitude values from the one-dimensional scan angles and plot our data in projected formats familiar to many geographic information tools.