Geographic Visualizations in Python with Cartopy
Cartopy is a cartographic Python library that was developed for applications in geographic data manipulation and visualization. It is the successor to the the Basemap Toolkit, which was the previous Python library used for geographic visualizations. Cartopy can be used to plot satellite data atop realistic maps, visualize city and country boundaries, track and predict movement based on geographic targeting, and a range of other applications relating to geographic-encoded data systems. In this tutorial, Anaconda 3 will be used to install Cartopy and related geographic libraries. As an introduction to the library and geographic visualizations, some simple tests will be conducted to ensure that the Cartopy library was successfully installed and is working properly. In subsequent tutorials: shapefiles will be used as boundaries, realistic city streets will be mapped, and satellite data will be analyzed.

Google Trends x Yahoo Finance Analysis in Python
Python has a multitude of libraries dedicated to scraping the internet in various ways. For example, Google Trends is a product produced by Google that analyzes search history and publishes the popularity of search terms over time. One user created an algorithm to pull trend data from Google using Python in a package called pytrends. Another such library uses Python to pull stock information from Yahoo Stocks in a package called yfinance. Both of these libraries will be used to plot and compare finance and trend data over time using Python scripts. The methods outlined in this tutorial could be applied to areas in finance, data analytics, and data visualization in general.
Arduino Heart Rate Monitor Using MAX30102 and Pulse Oximetry
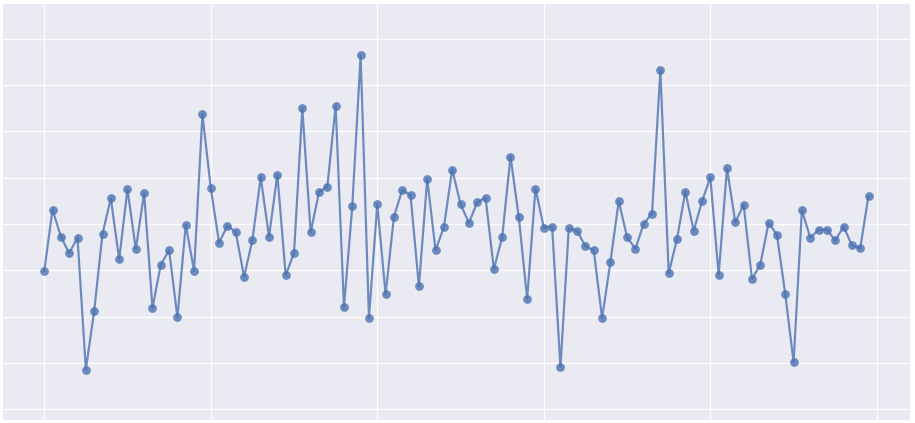
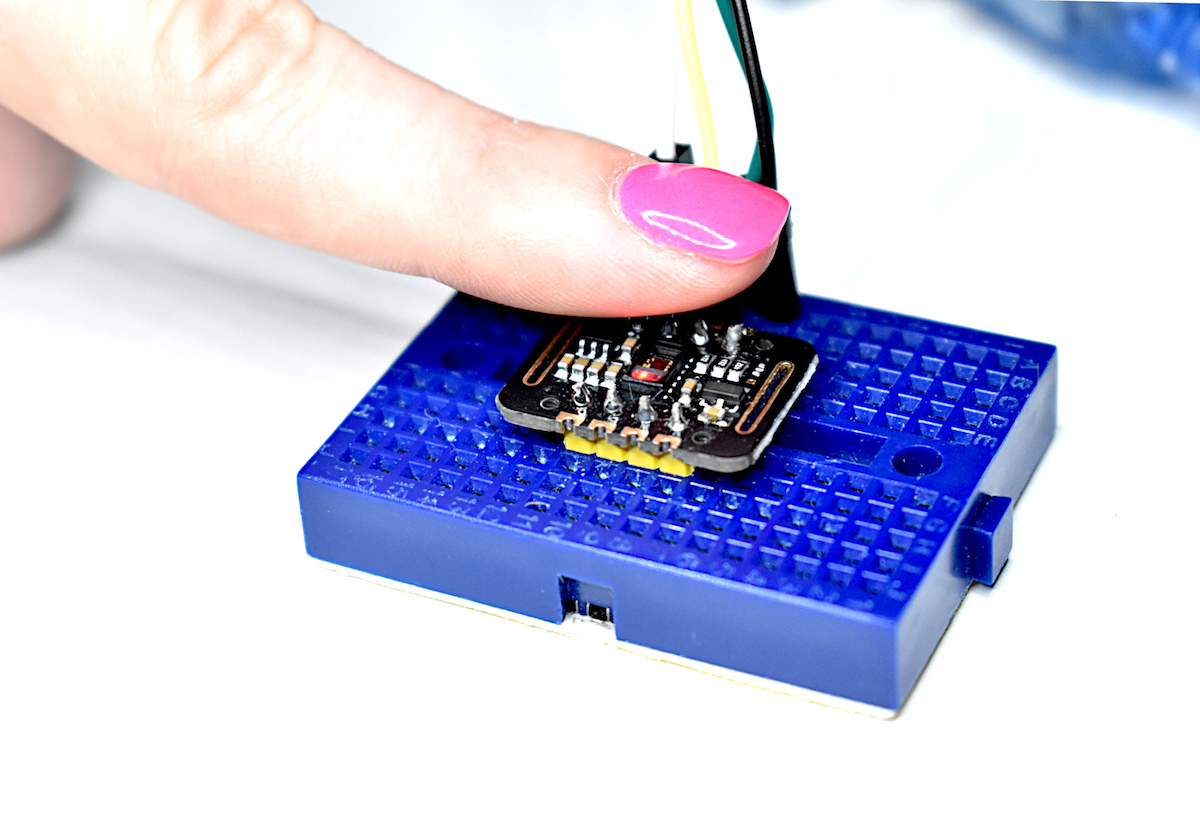
Pulse oximetry monitors the oxygen saturation in blood by measuring the magnitude of reflected red and infrared light [read more about pulse oximetry here and here]. Pulse oximeteters can also approximate heart rate by analyzing the time series response of the reflected red and infrared light . The MAX30102 pulse oximeter is an Arduino-compatible and inexpensive sensor that permits calculation of heart rate using the method described above. In this tutorial, the MAX30102 sensor will be introduced along with several in-depth analyses of the red and infrared reflection data that will be used to calculate parameters such as heart rate and oxygen saturation in blood.
Image Processing with Raspberry Pi and Python
The Raspberry Pi has a dedicated camera input port that allows users to record HD video and high-resolution photos. Using Python and specific libraries written for the Pi, users can create tools that take photos and video, and analyze them in real-time or save them for later processing. In this tutorial, I will use the 5MP picamera v1.3 to take photos and analyze them with Python and an Pi Zero W. This creates a self-contained system that could work as an item identification tool, security system, or other image processing application. The goal is to establish the basics of recording video and images onto the Pi, and using Python and statistics to analyze those images.

Audio Processing in Python Part III: Guitar String Theory and Frequency Analysis
In this continuation of the audio processing in Python series, I will be discussing the live frequency spectrum and its application to tuning a guitar. I will introduce the idea of nodes and antinodes of a stringed instrument and the physical phenomena known as harmonics. This will give us a better idea of how to tune the guitar string-by-string and also discern the notes of a given chord - all calculated using the FFT function in Python.