Heat Transfer of the Raspberry Pi Using Arduino, An Infrared Thermometer, and Type-K Thermocouple
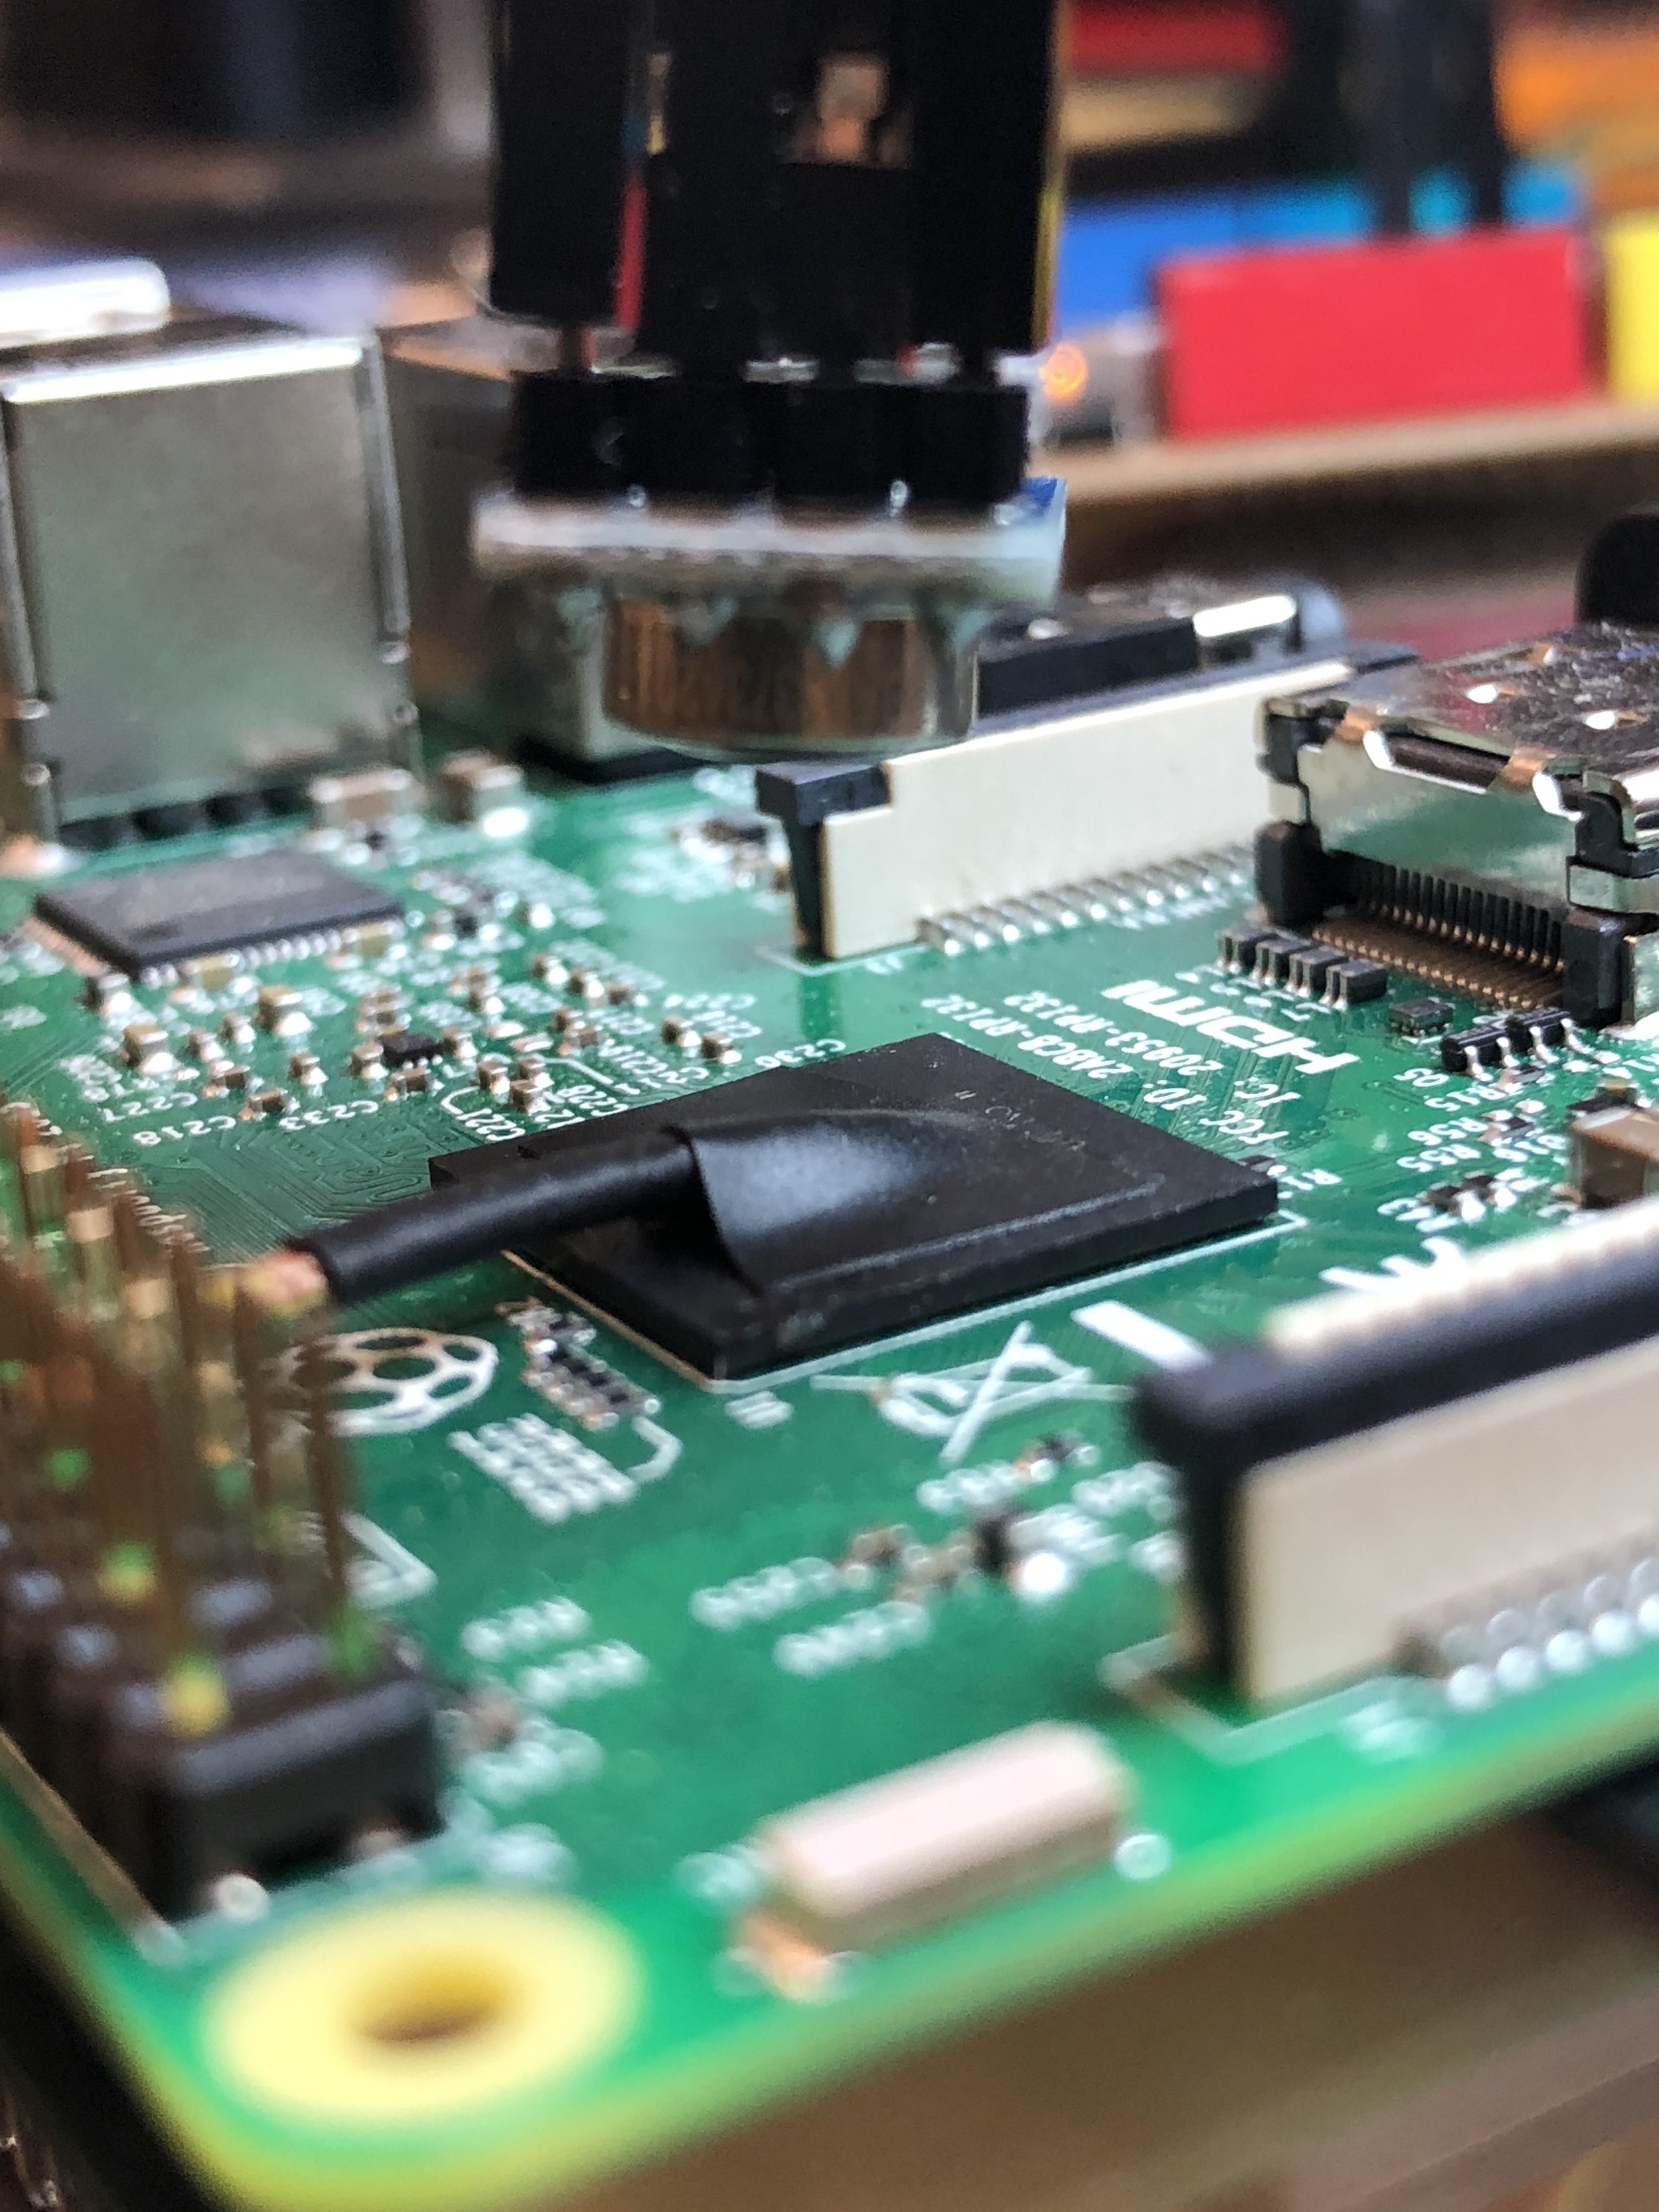
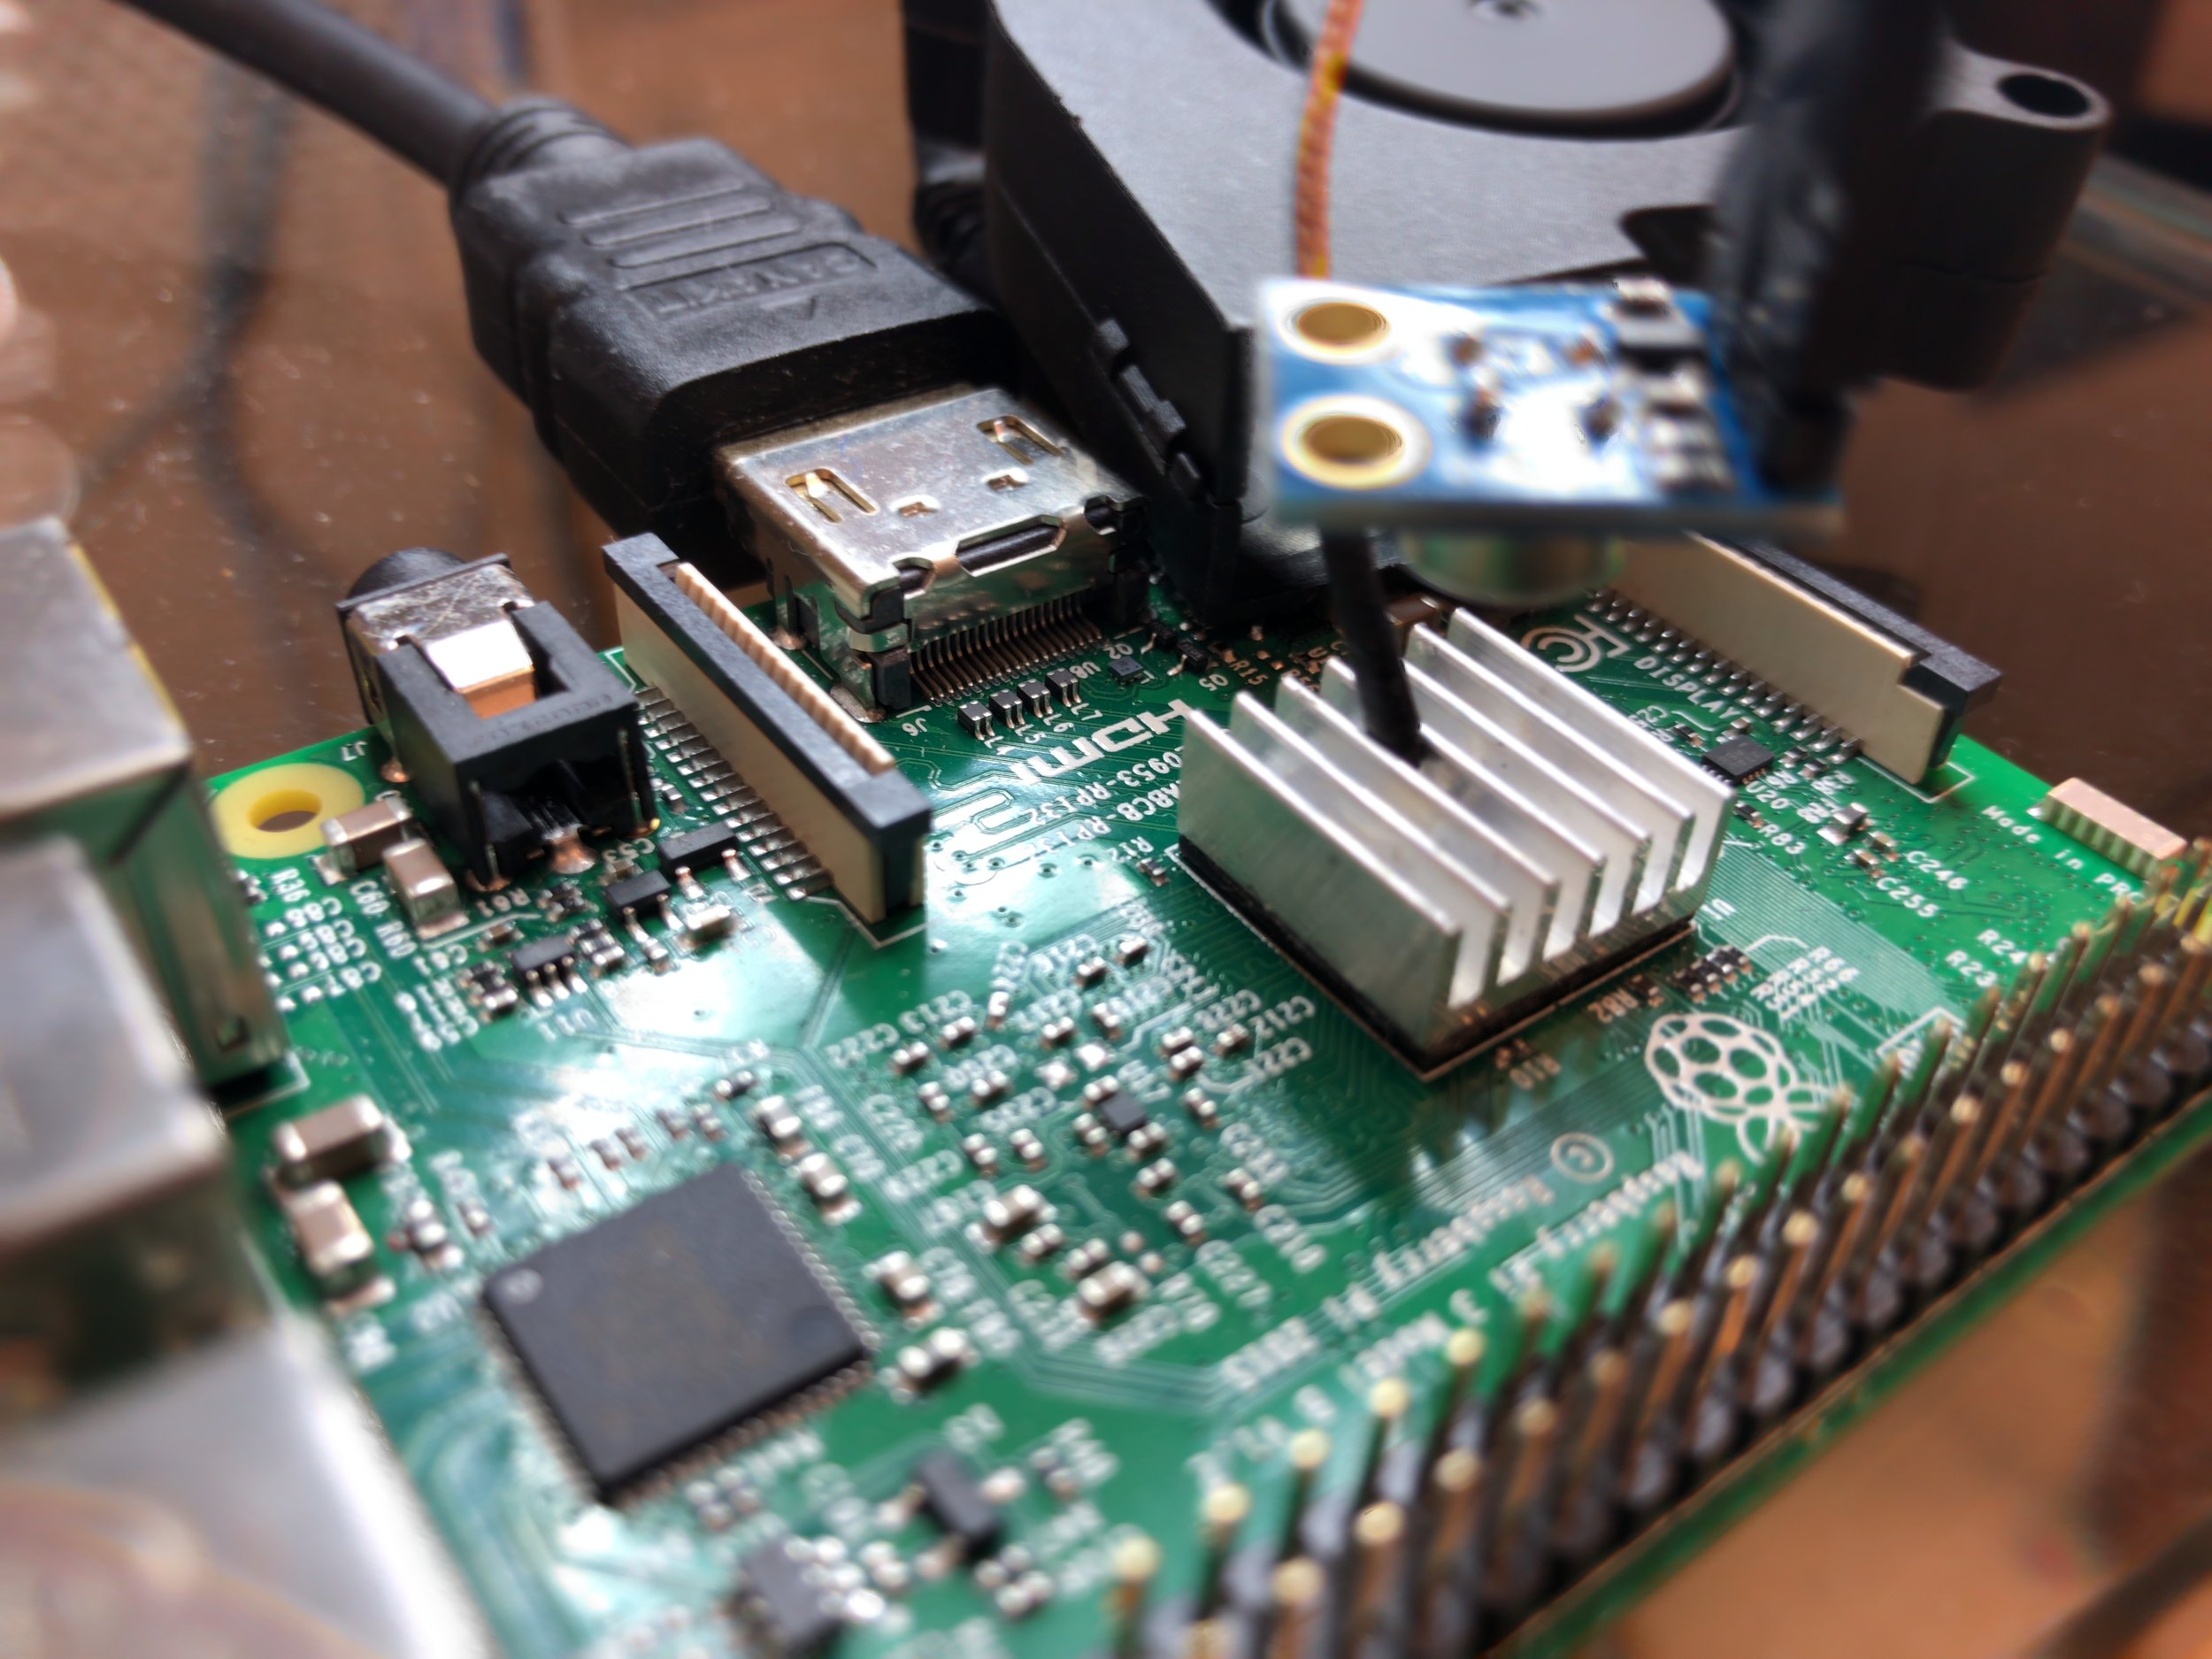
The Raspberry Pi 3's primary heat source is its central processing unit, the BCM2837. The heat generated by the chip (shown in Figure 1) is investigated here using three sensors simultaneously monitoring temperature. A thermocouple was placed atop the ceramic casing, an infrared thermometer was pointed at the casing, and the CPU's internal temperature readout were used. The behavior of the chip was studied under various operating conditions in the form of CPU percentages ranging from 5%-82%. Three separate cooling methods were also explored using ambient air cooling, fan cooling (13 CFM), and a fan-cooled aluminum heat sink. The goal of this experiment was to investigate cooling and heat generation of the CPU under exertion conditions within the computer's operating range.

Figure 1: The Raspberry Pi's main chip: Broadcom's BCM2837.
Parts and Arduino Wiring
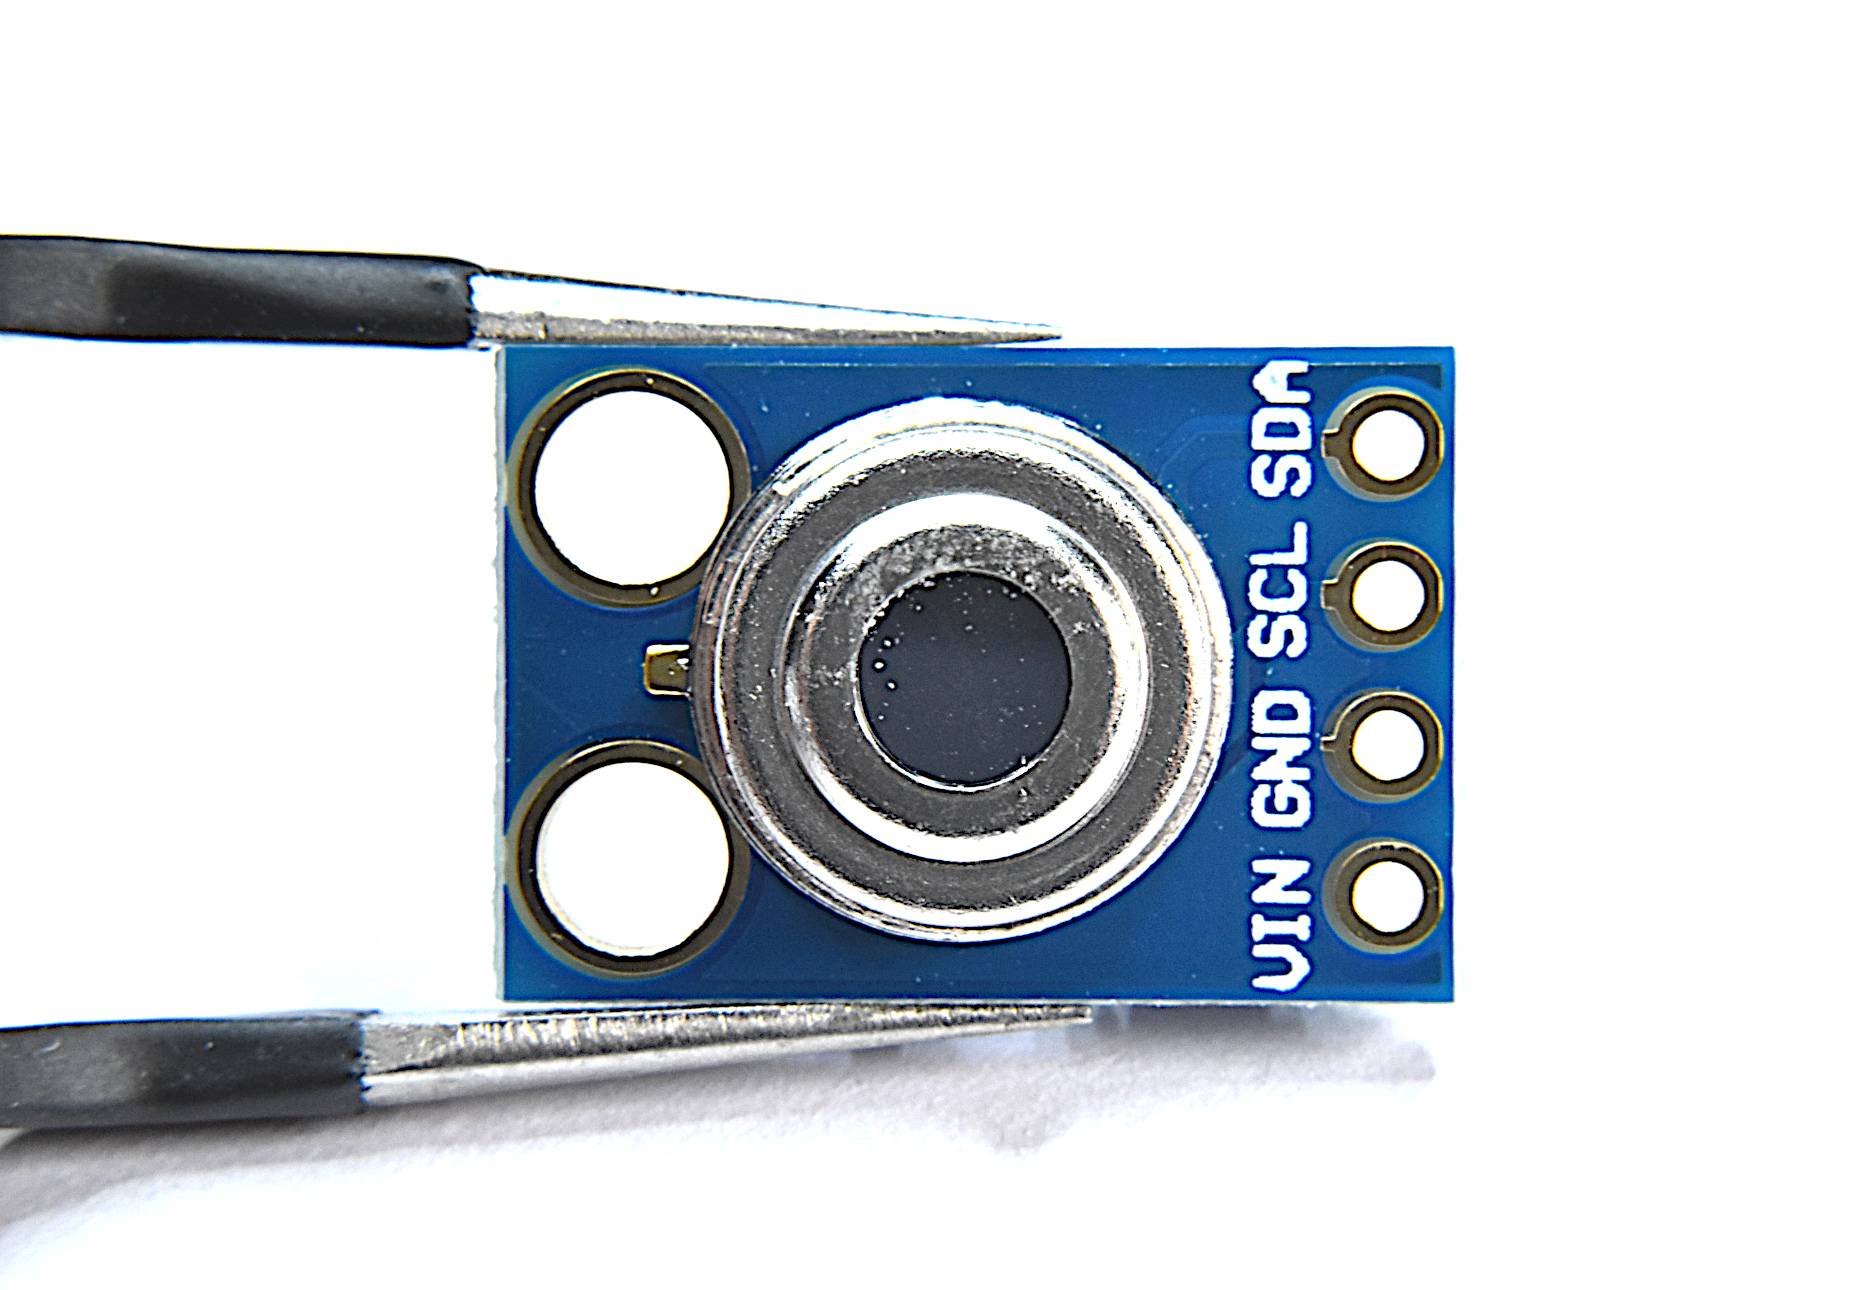
I used an Arduino Uno to log data from the external thermocouple and infrared thermometer (MLX90614). The thermocouple should be wired to the MAX6675 module, and the IR thermometer should be wired using its pins (see below). The MLX90614 infrared thermometer has a measurement range of -70 < T < +380 Celsius, and the Type-K thermocouple has a range of -270 < T < +1372 Celsius. The temperature for the RPi's chip under normal operating conditions should never exceed 80 Celsius, so we are assuredly within operating conditions for each sensor. The diagram for the Arduino and sensor hookup is shown below, along with a table of the pin-to-pin wiring:
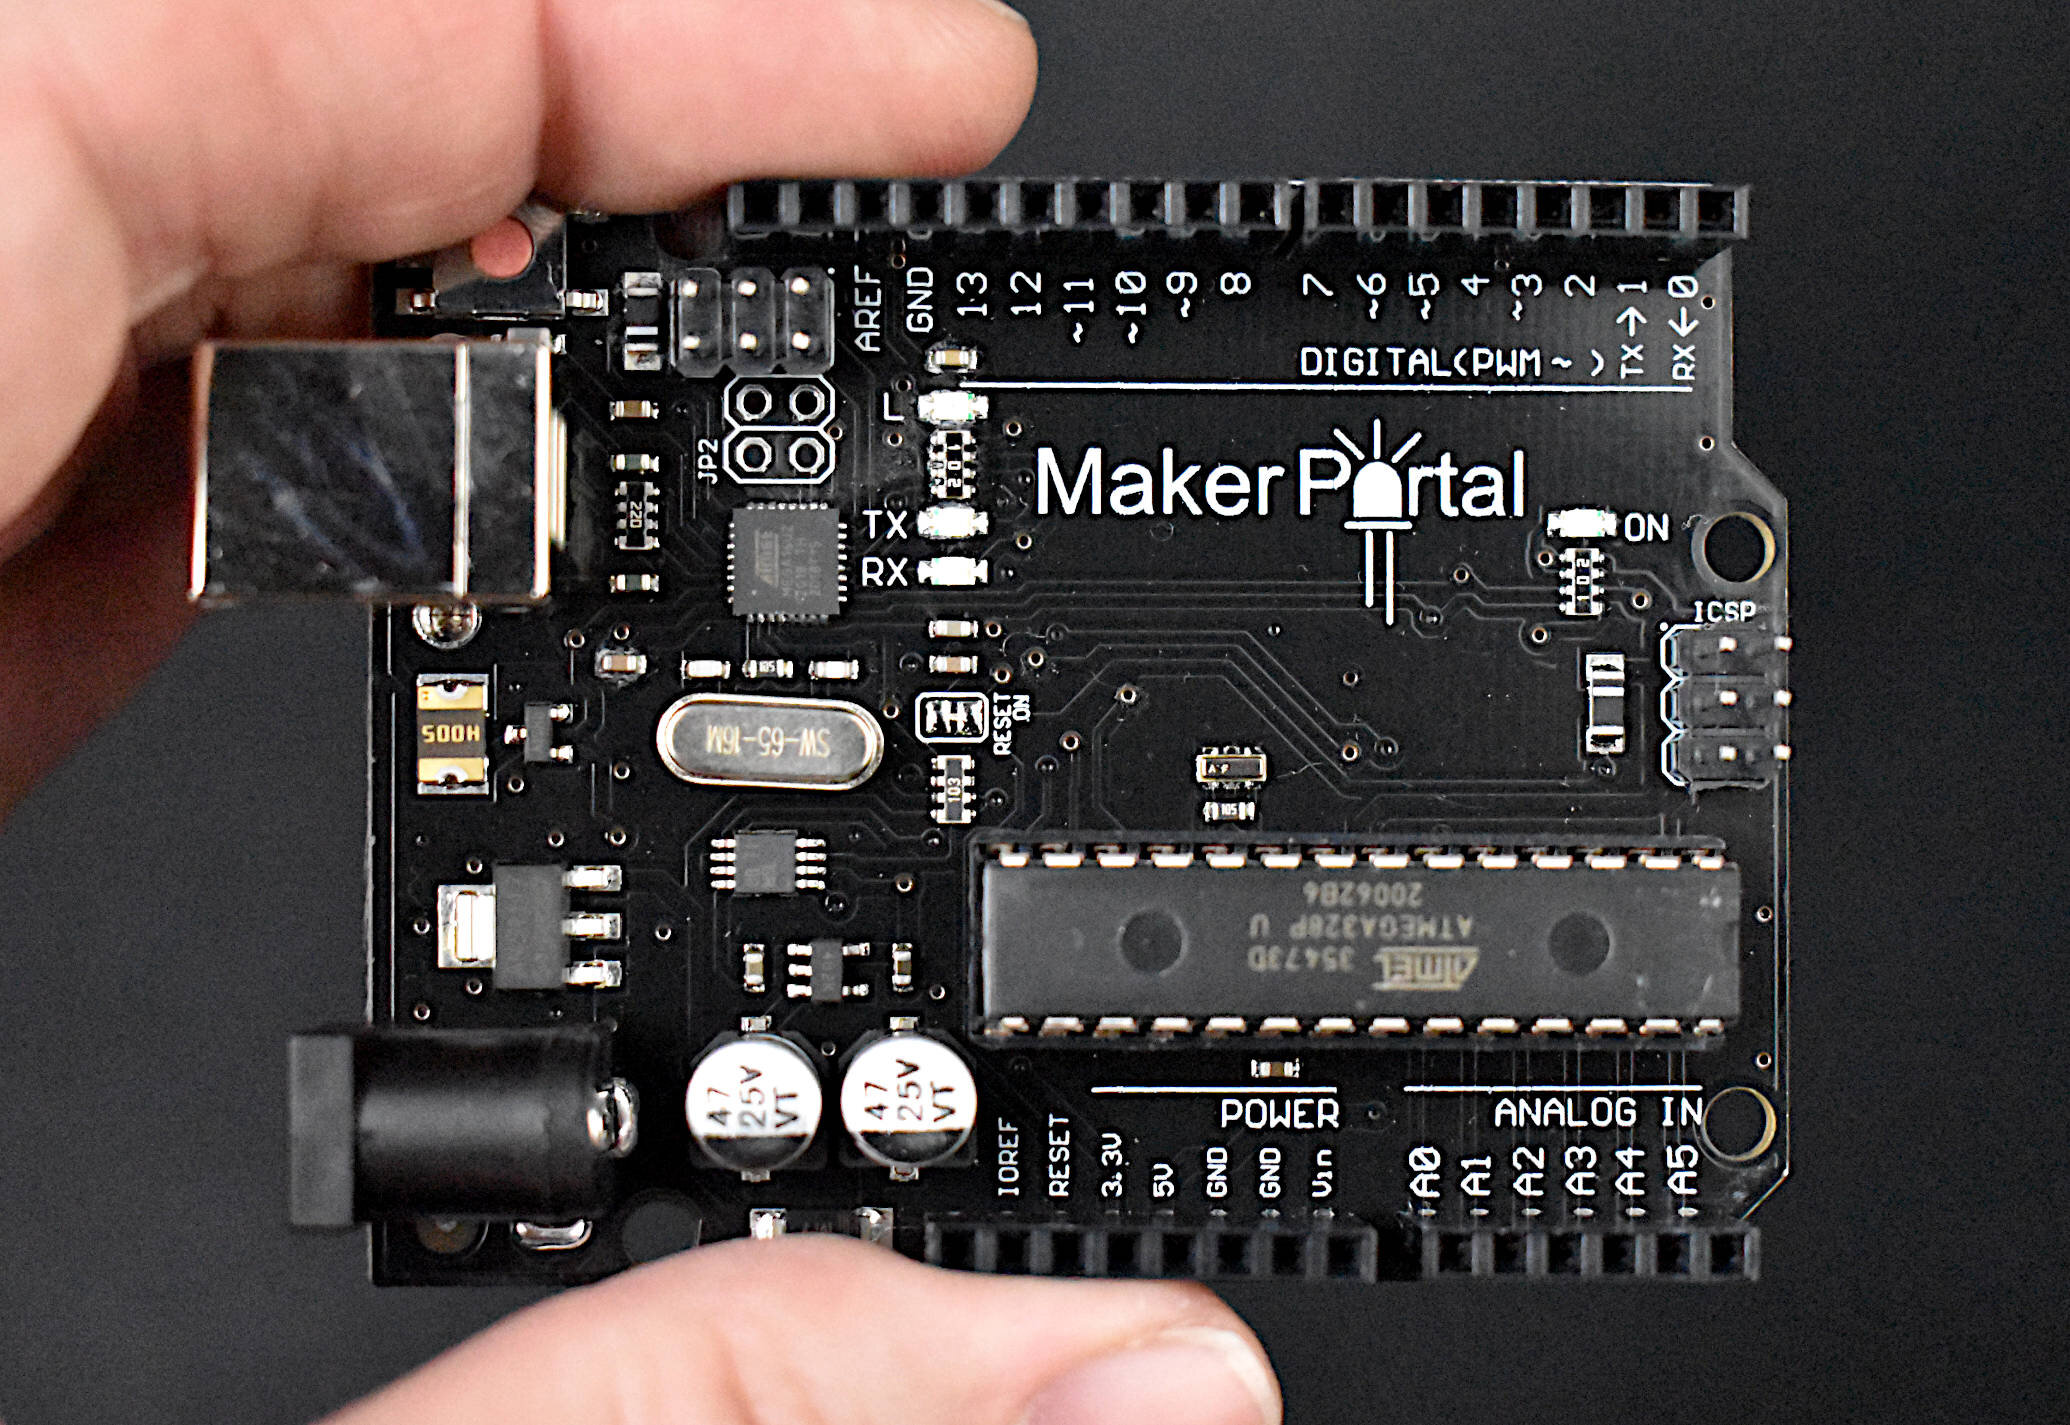
The Maker Portal Uno board is the centerpiece of many of the projects carried out in our maker spaces. The Uno board is capable of reading a wide range of sensors using analog-to-digital conversion, SPI, I2C, UART, and other common protocols. The Uno board can be used to control motors, OLED/LCD displays, and LEDs. The Arduino Uno board shown here is the official Maker Portal microcontroller, which we use in many of our projects!
Included in the Arduino Uno Package:
Maker Portal Arduino Uno Rev3 Board
Black USB Cable (1m in Length)
Specifications for Arduino Uno Rev3 Board:
ATmega328P chip with Arduino Bootloader
14 digital pins, 6 analog pins
10-bit analog-to-digital converter (ADC)
5V-12V Supply Tolerance
3.3V and 5.0V output pins
16 MHz clock
5 PWM pins, I2C support, SPI support , UART support
ATmega16U2 USB TTL, compatible with Linux, Windows, and Mac
Black Stylish Finish
Fully Integrated with Arduino IDE software
What comes in this package:
MLX90614 IR sensor
MLX90614 Specs:
3-5V Operating Voltage
-70 °C to 380 °C Object Temperature Measurement Range
0.5 °C Accuracy (0-50 °C)
0.02 °C Measurement Resolution’
At 35° Viewing Angle, Temperature is half the 0° Angle Value
I2C Wiring works with Arduino and Raspberry Pi
Full Datasheet download here

The Raspberry Pi 4 Computer, Model B is the latest in the series of single-board computers (SBC) produced by the Raspberry Pi Foundation. The RPi 4 increased its processor speed, its GPU performance, memory (1GB, 2GB, 4B, 8GB options), and connectivity. The Raspberry Pi 4 computer continues to be an essential tool in the maker, programmer, and engineer communities. The Raspberry Pi 4 is capable of interfacing with a wide range of sensors, motors, actuators, and devices. The RPi 4 has the standard 40-pin header with general purpose input/outputs (GPIOs), Bluetooth and WiFi capabilities, HDMI output display abilities, and much more! Our site contains a variety of different tutorials in the categories of Python programming, data acquisition and analysis, motor control, internet of things (IoT), engineering, among others.
Included with the Raspberry Pi 4 Model B Computer:
1x Raspberry Pi 4 Model B Computer
Features of the Raspberry Pi 4 Model B Computer:
Broadcom BCM2711, Quad core Cortex-A72 (ARM v8) 64-bit SoC @ 1.5GHz
LPDDR4-3200 SDRAM (2GB, 4GB, 8GB depending on the model)
2.4 GHz and 5.0 GHz WiFi, Bluetooth 5.0, Bluetooth Low Energy (BLE)
Gigabit Ethernet
2x USB 3.0 ports; 2x USB 2.0 ports
Raspberry Pi standard 40-pin GPIO header (fully backwards compatible with previous boards)
2x micro-HDMI ports (up to 4K @60fps supported)
2-lane MIPI DSI display port, 2-lane MIPI CSI camera port
4-pole stereo audio and composite video port
H.265 (4kp60 decode), H264 (1080p60 decode, 1080p30 encode)
Micro-SD card slot for loading operating system and data storage
5V DC via USB-C connector, 5V DC via GPIO header (3A Recommended Supply)
Operating Temperature (Ambient): 0°C – 50°C
Raspberry Pi Peripherals:
6x UART, 6x I2C, 5x SPI, 1x SDIO, 1x DPI, 1x PCM, 2x PWM Channels, 3x GPCLK
| Arduino | Sensor |
|---|---|
| 5V | VIN (MLX90614) |
| GND | GND (MLX90614) |
| A5 | SCL (MLX90614) |
| A4 | SDA (MLX90614) |
| D2 | GND (MAX6675) |
| D3 | VCC (MAX6675) |
| D4 | SO (MAX6675) |
| D5 | CS (MAX6675) |
| D6 | SCK (MAX6675) |
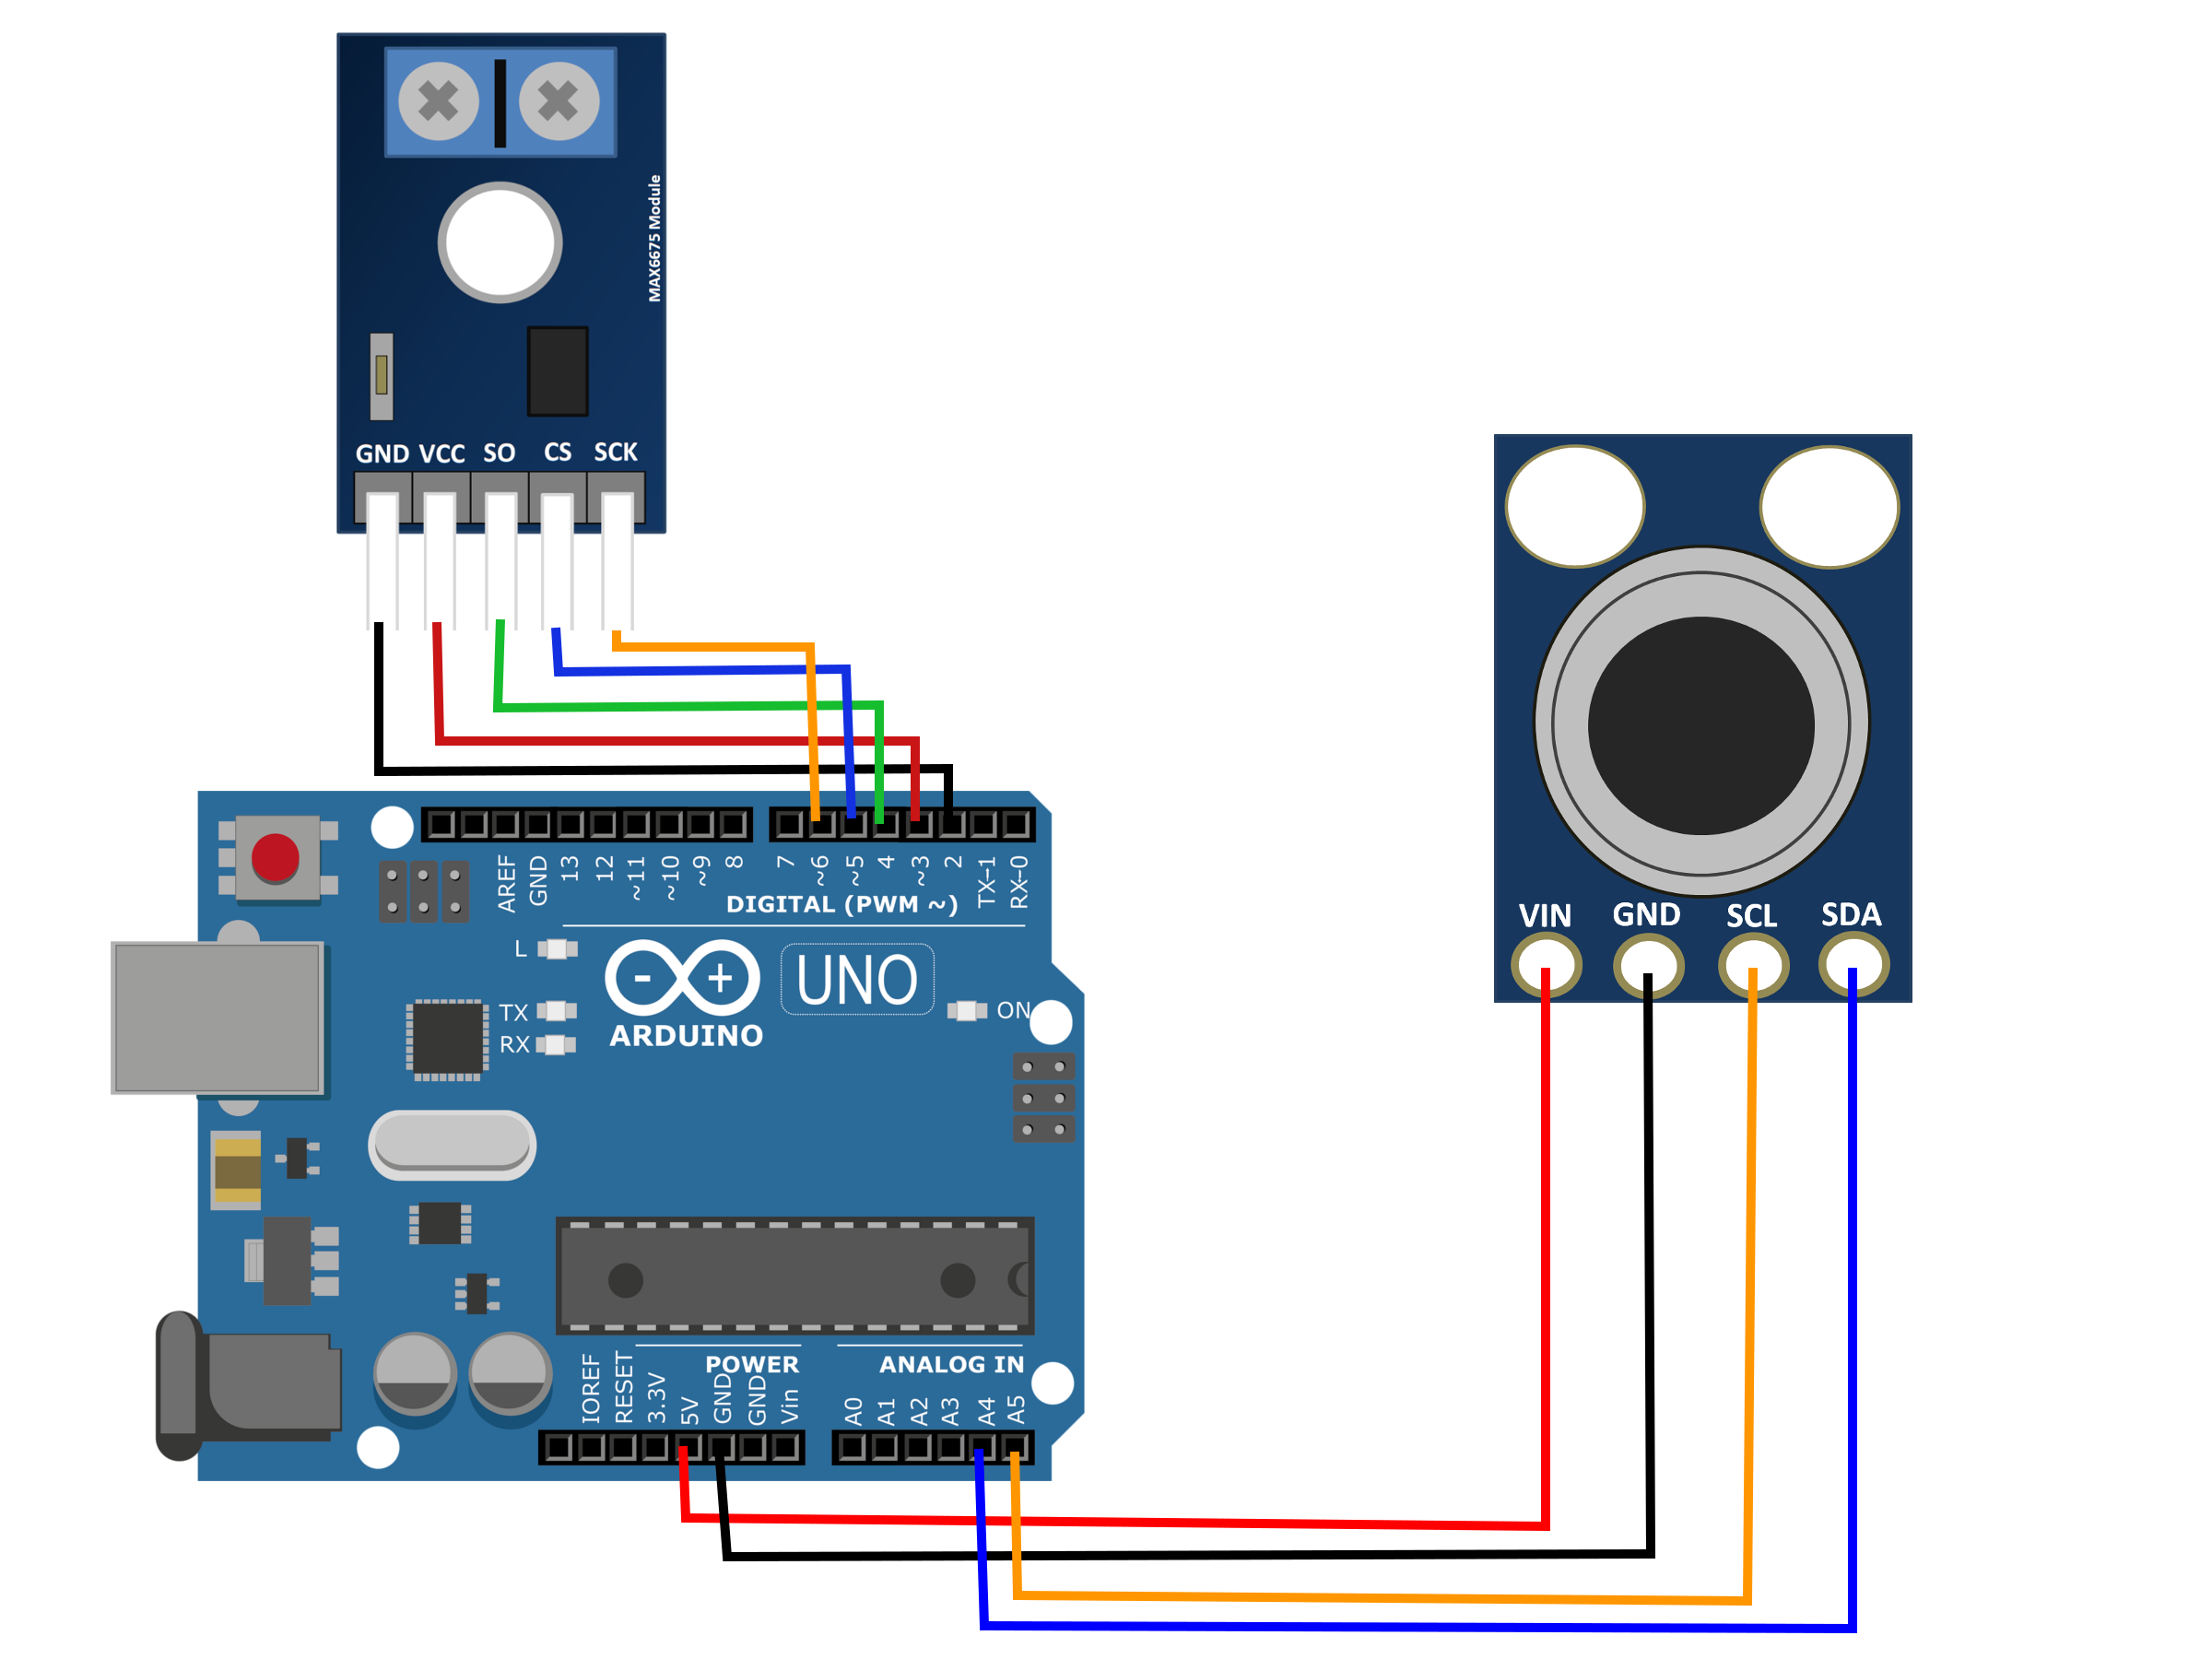
Figure 2: Wiring diagram for IR thermometer and thermocouple to Arduino Uno.
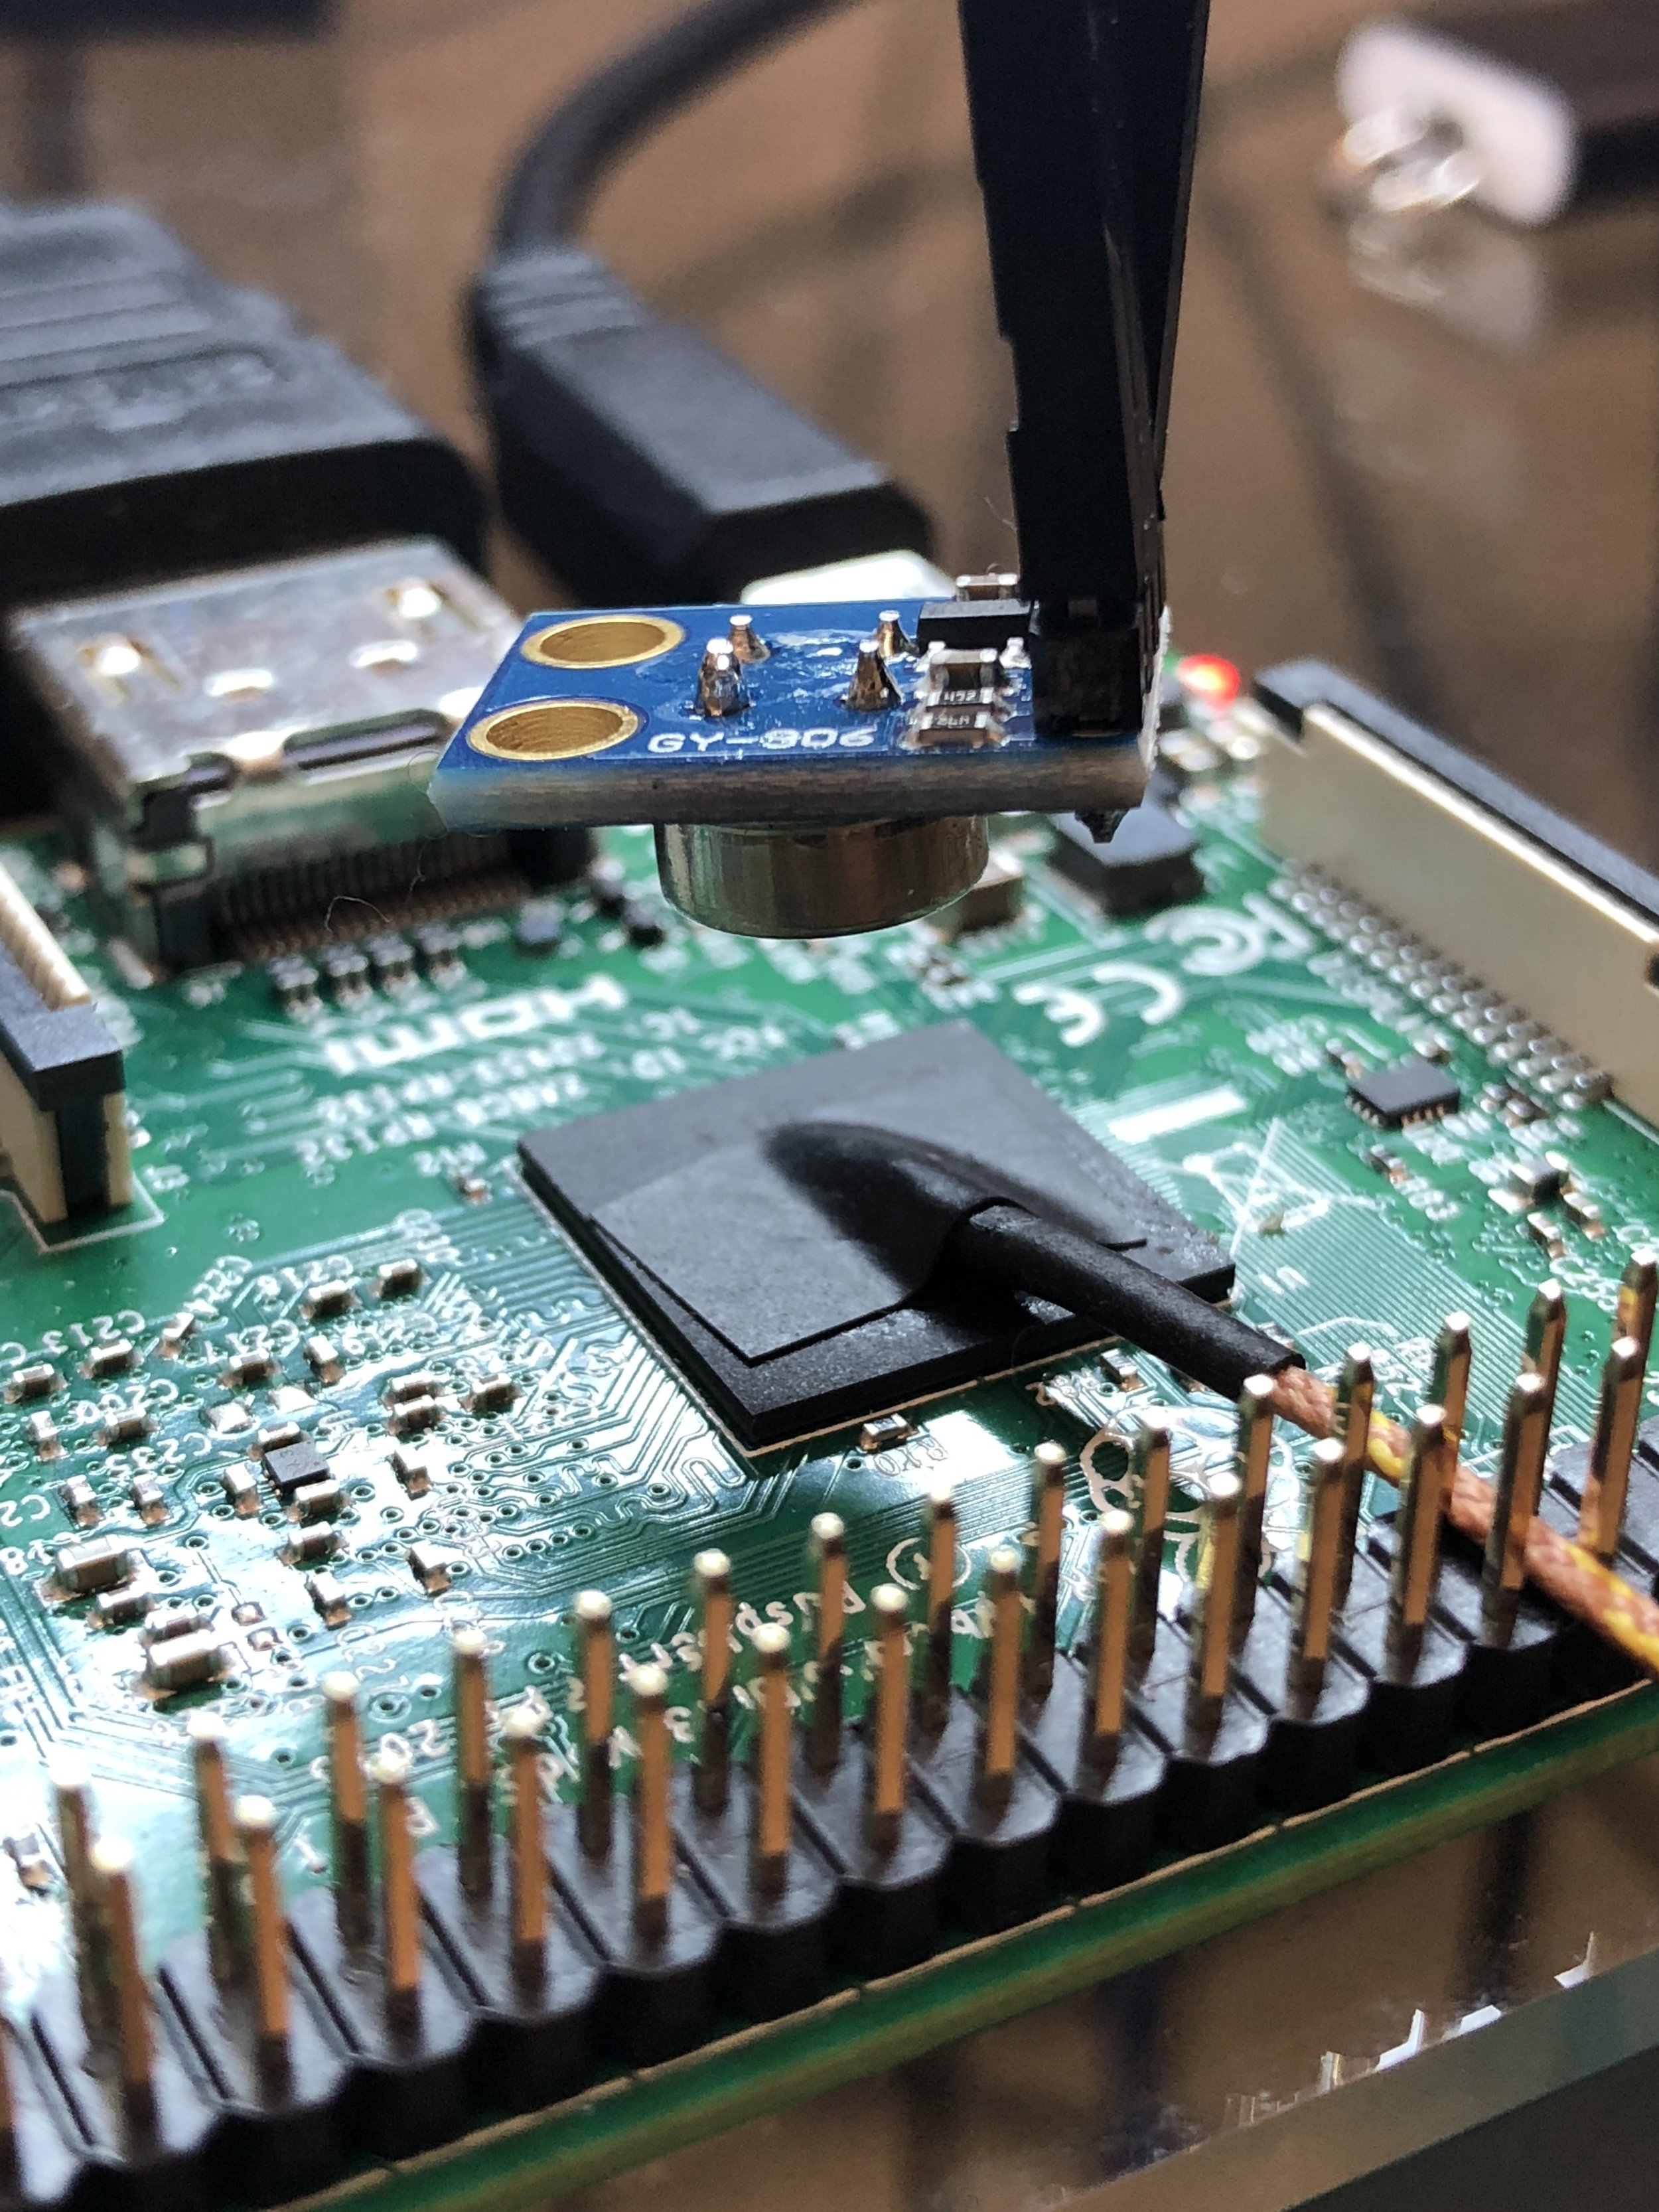
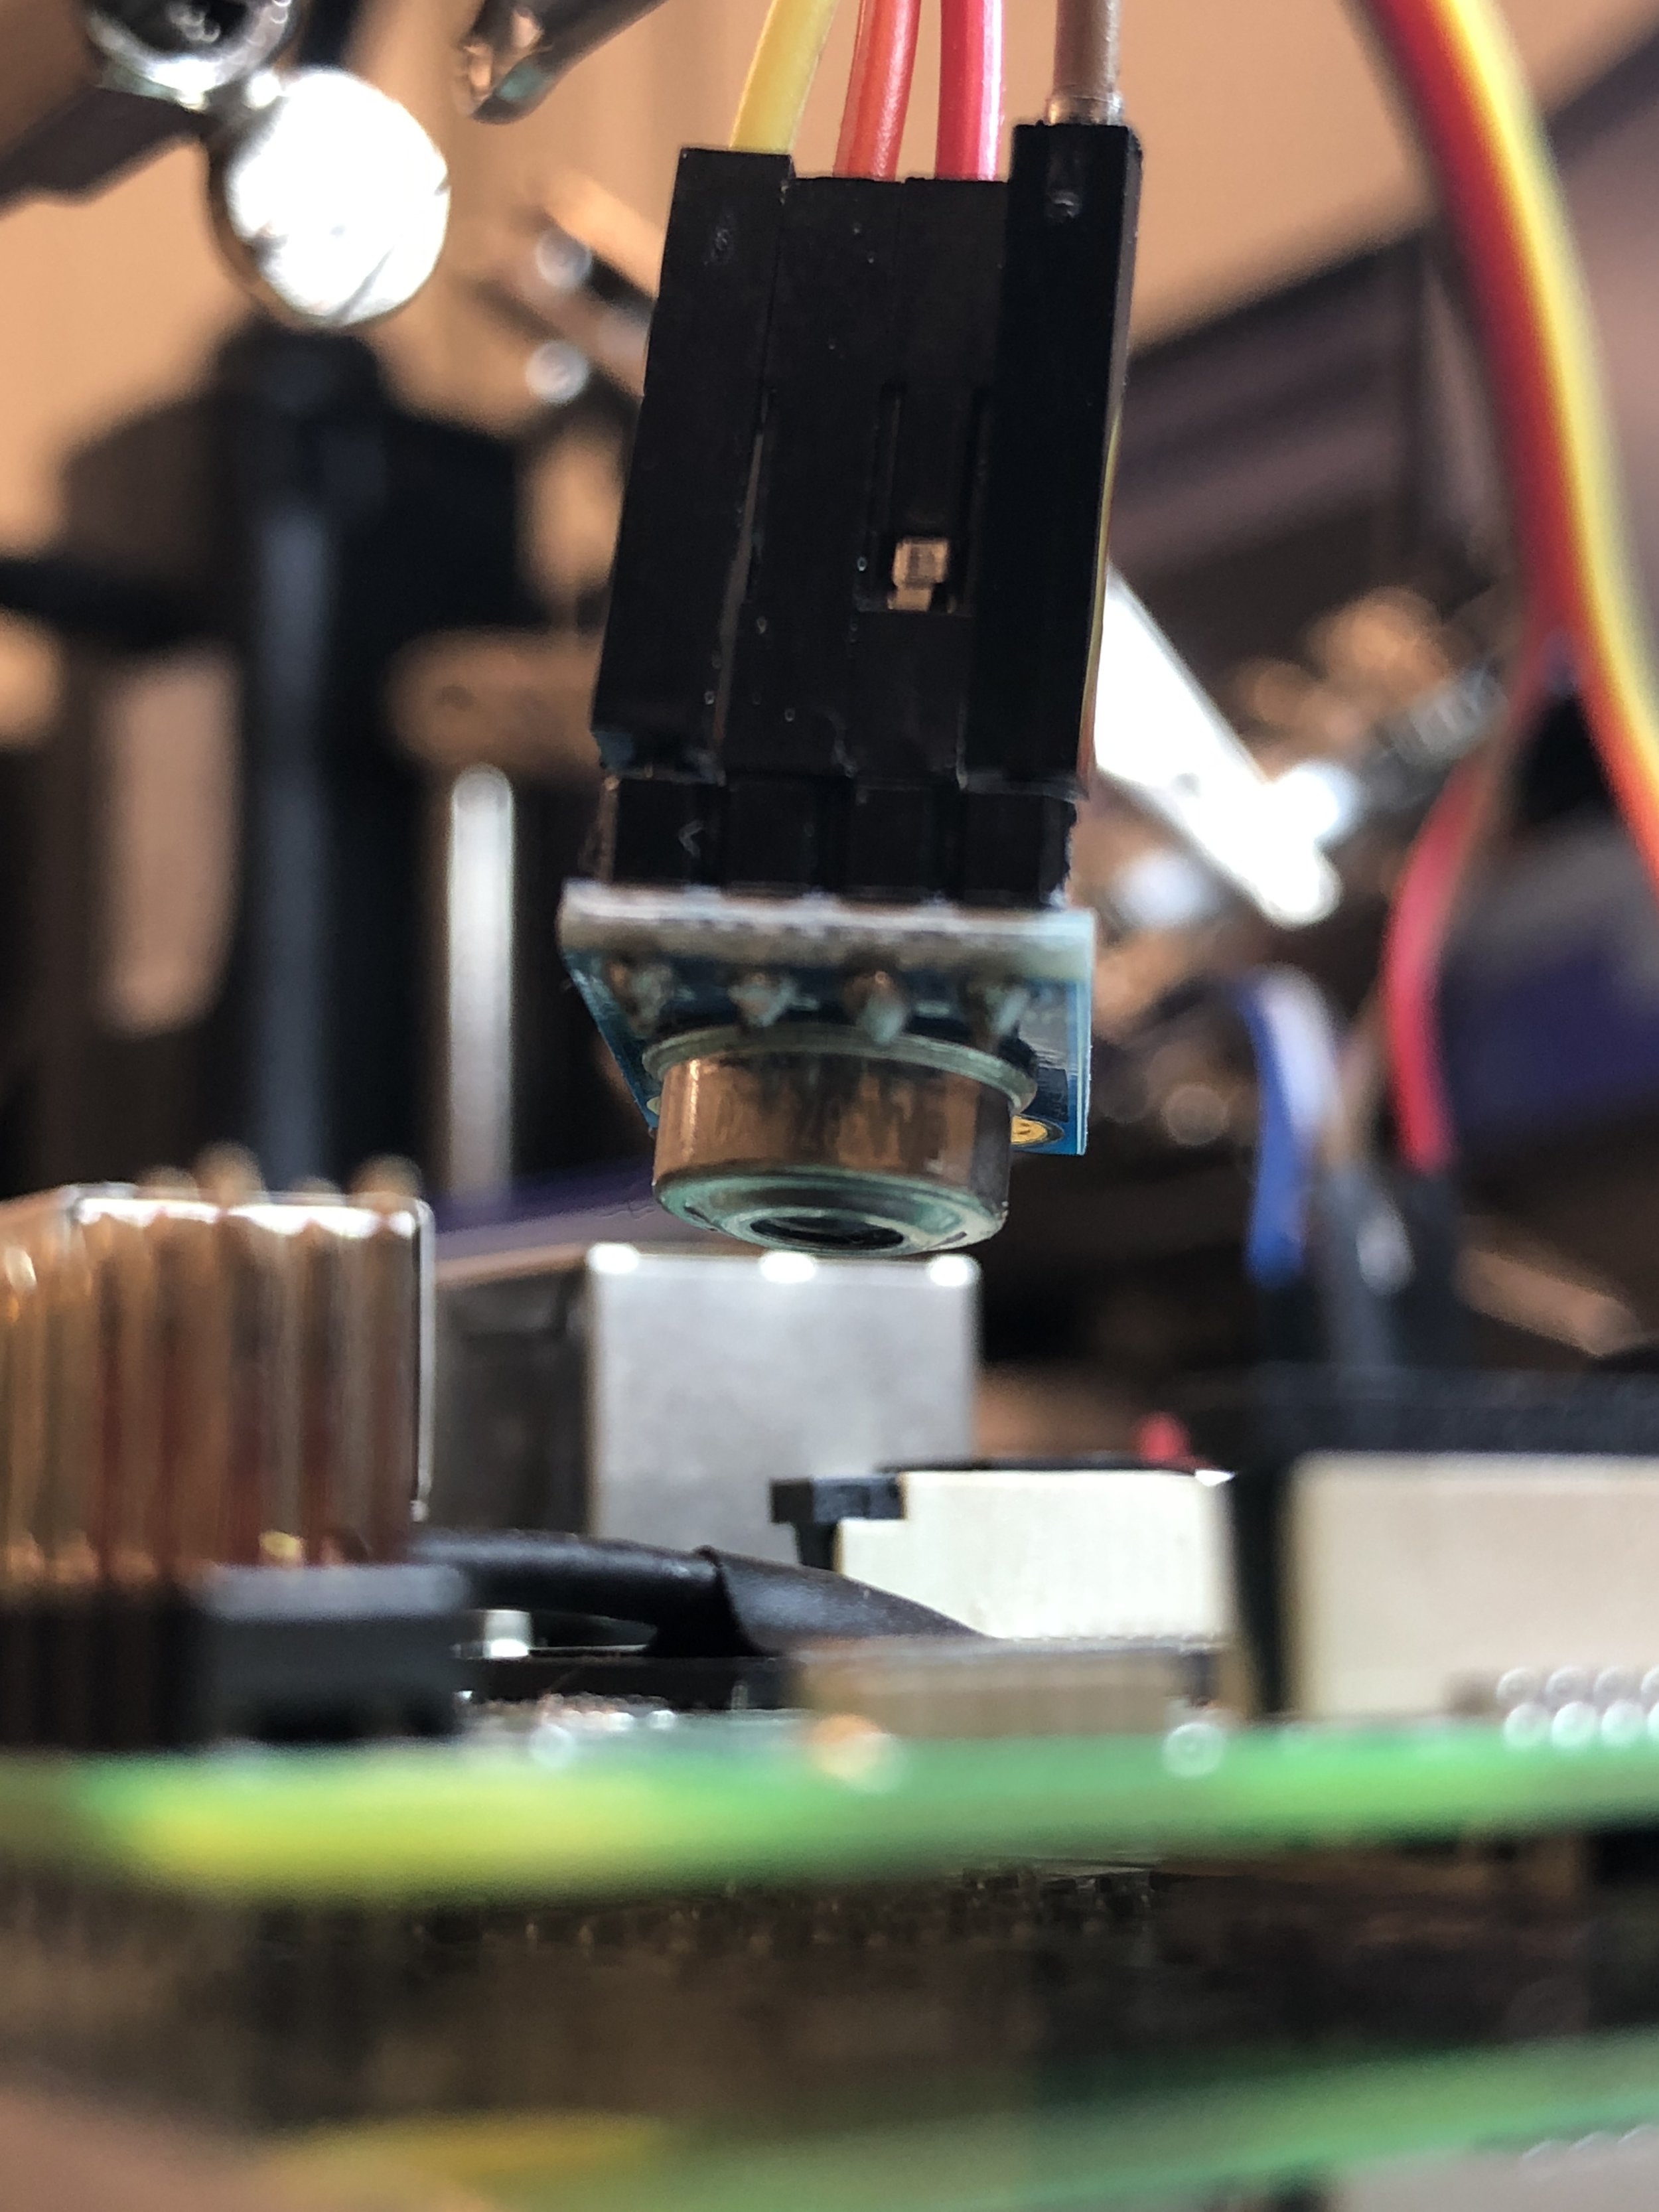
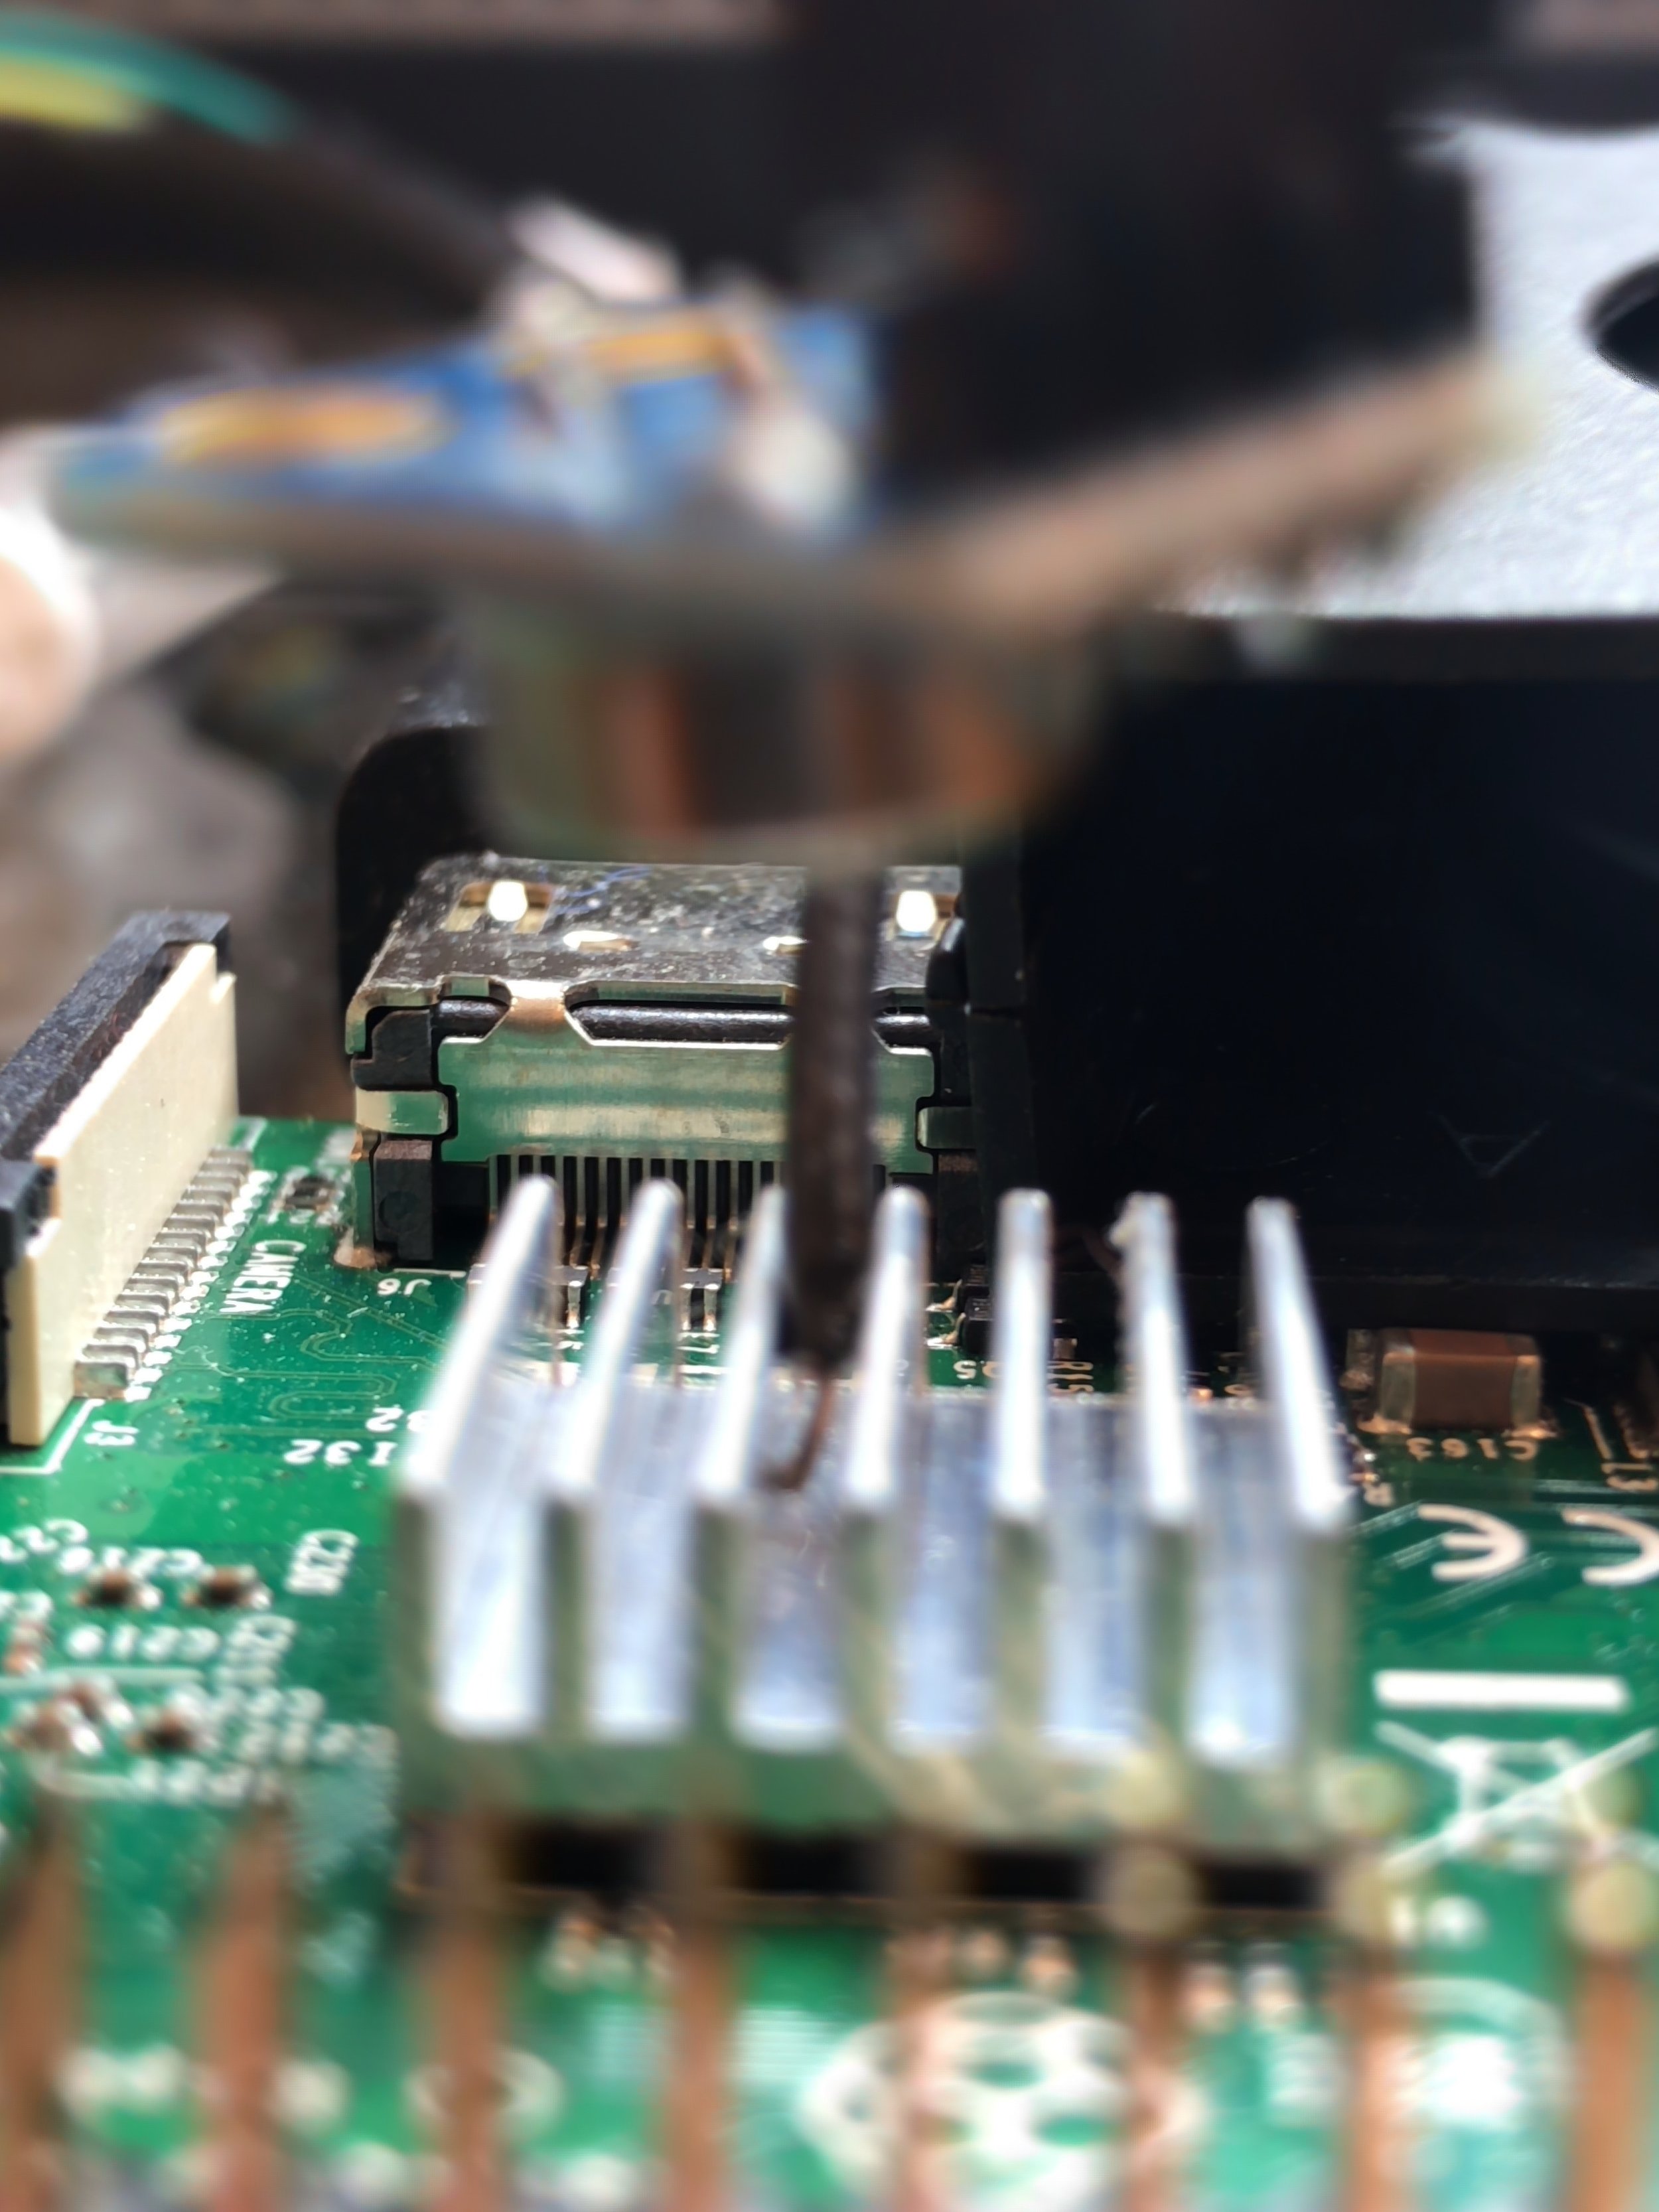
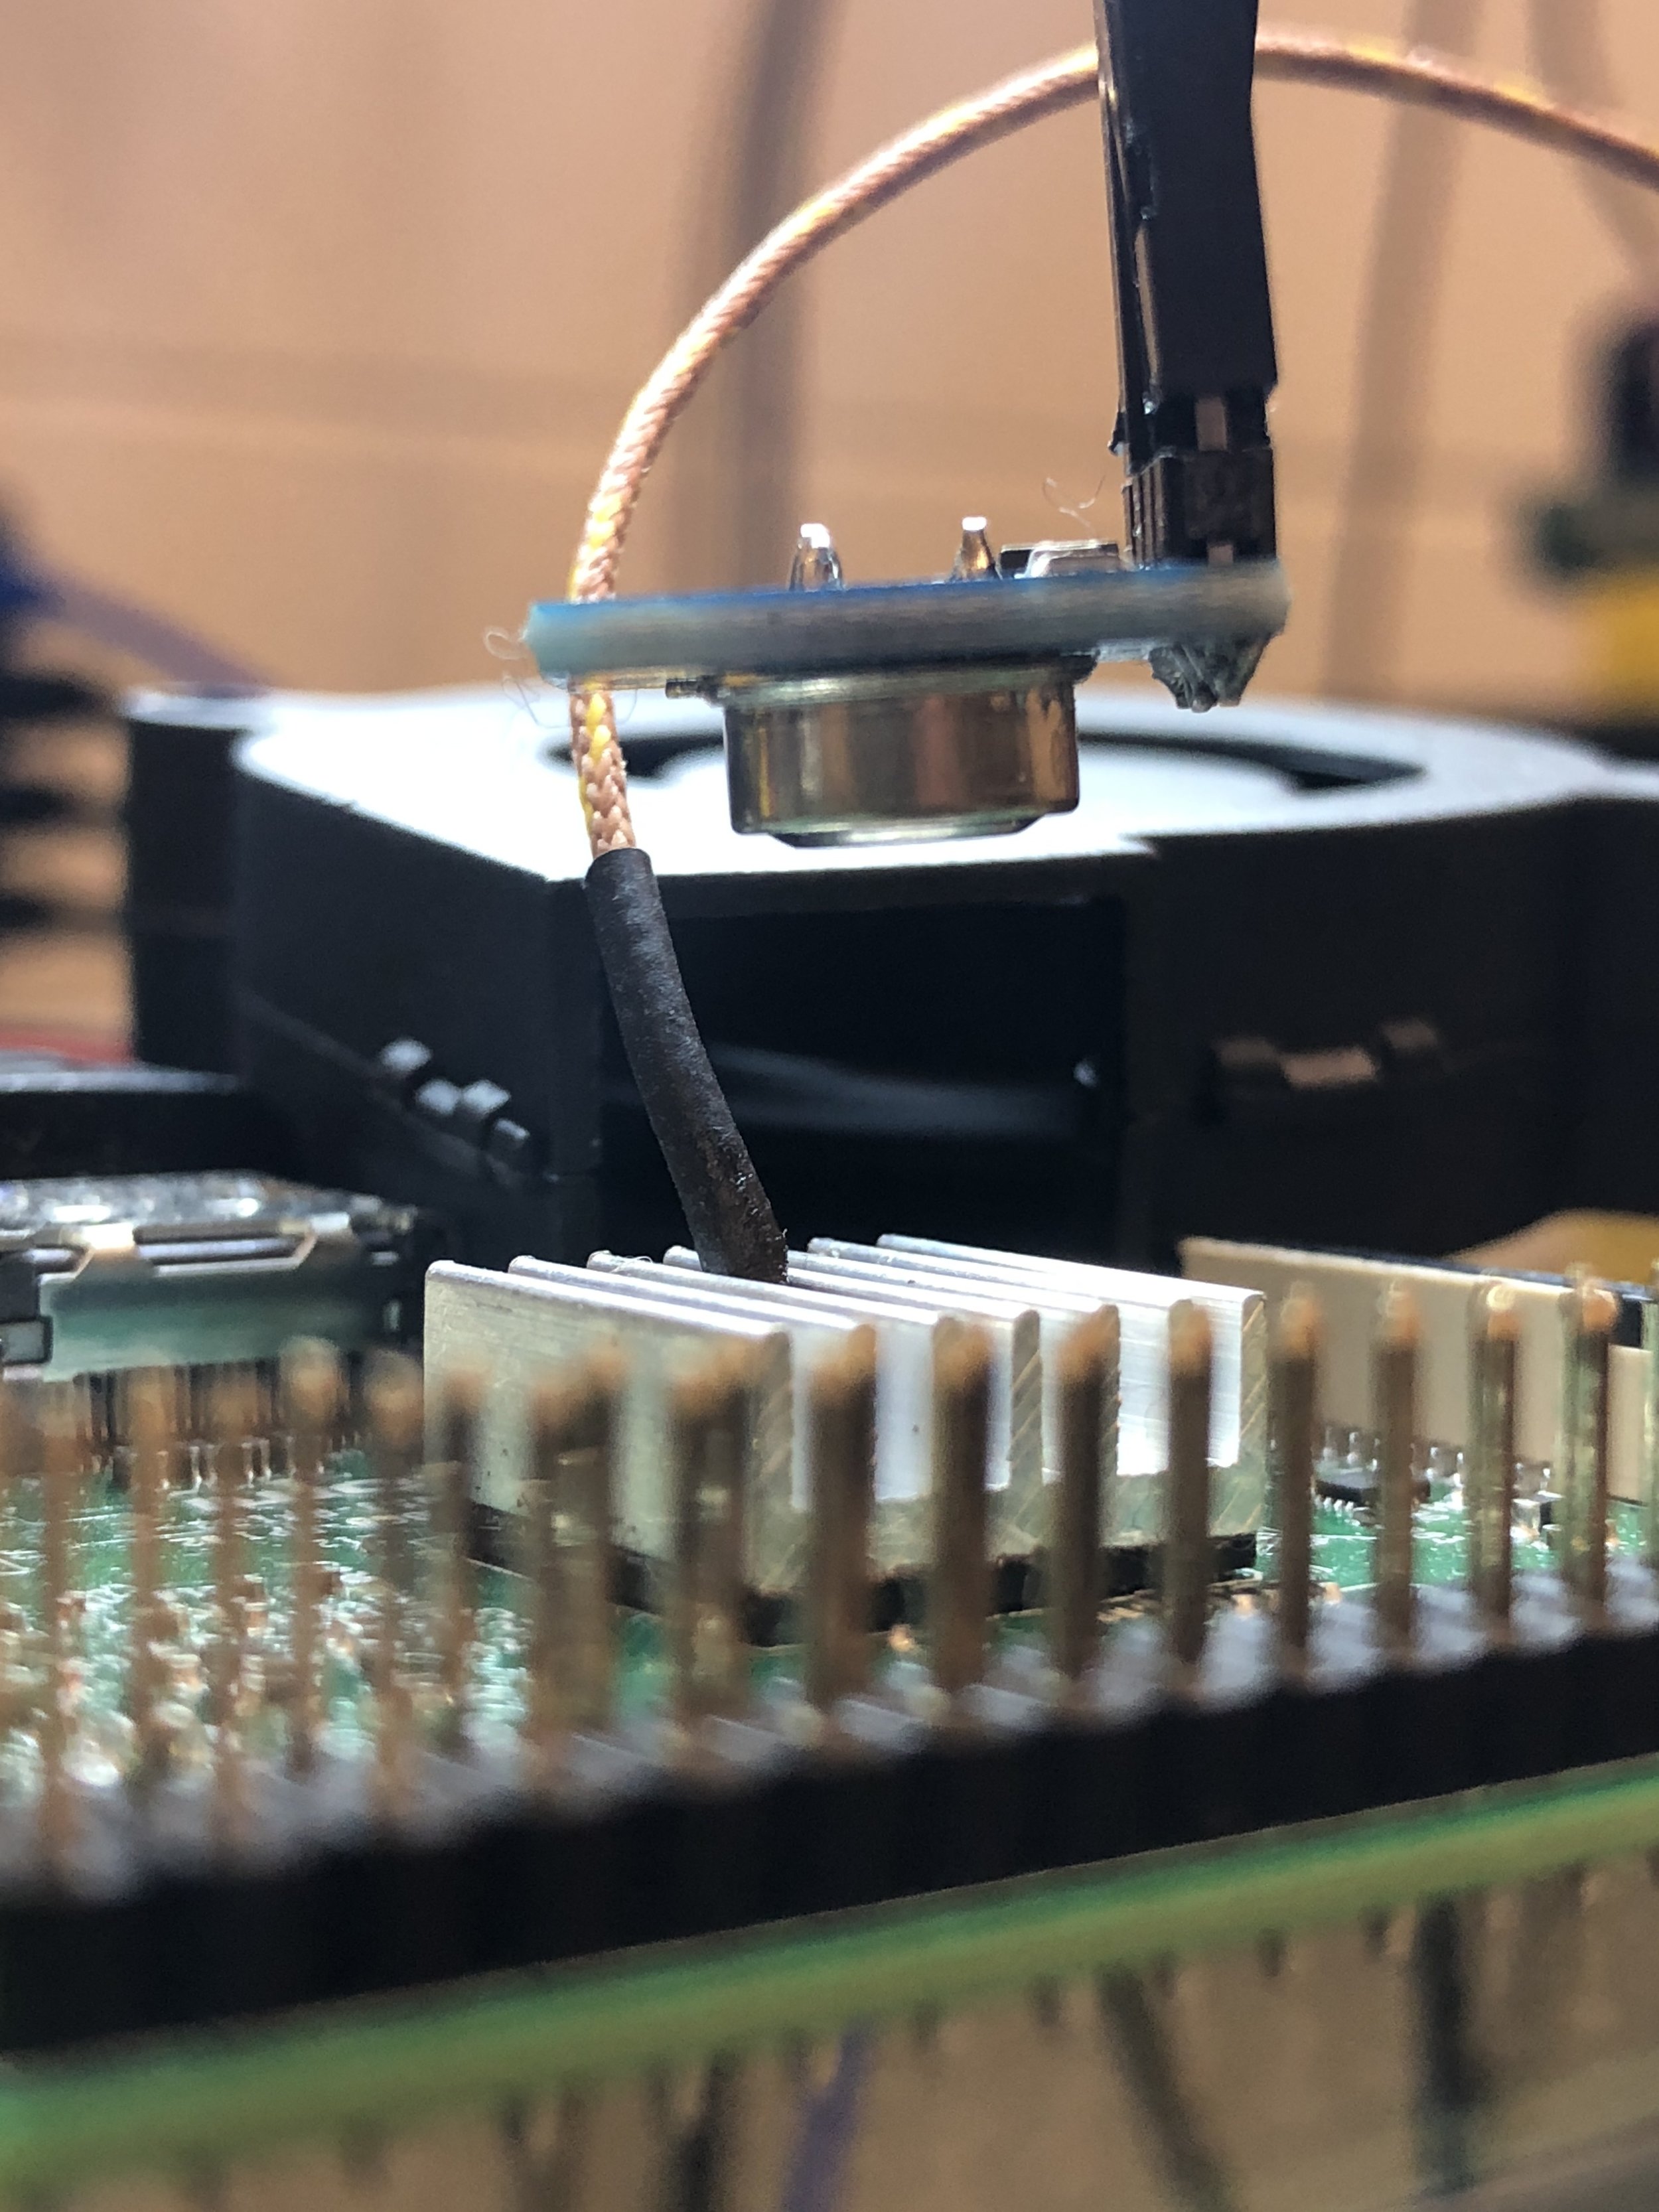
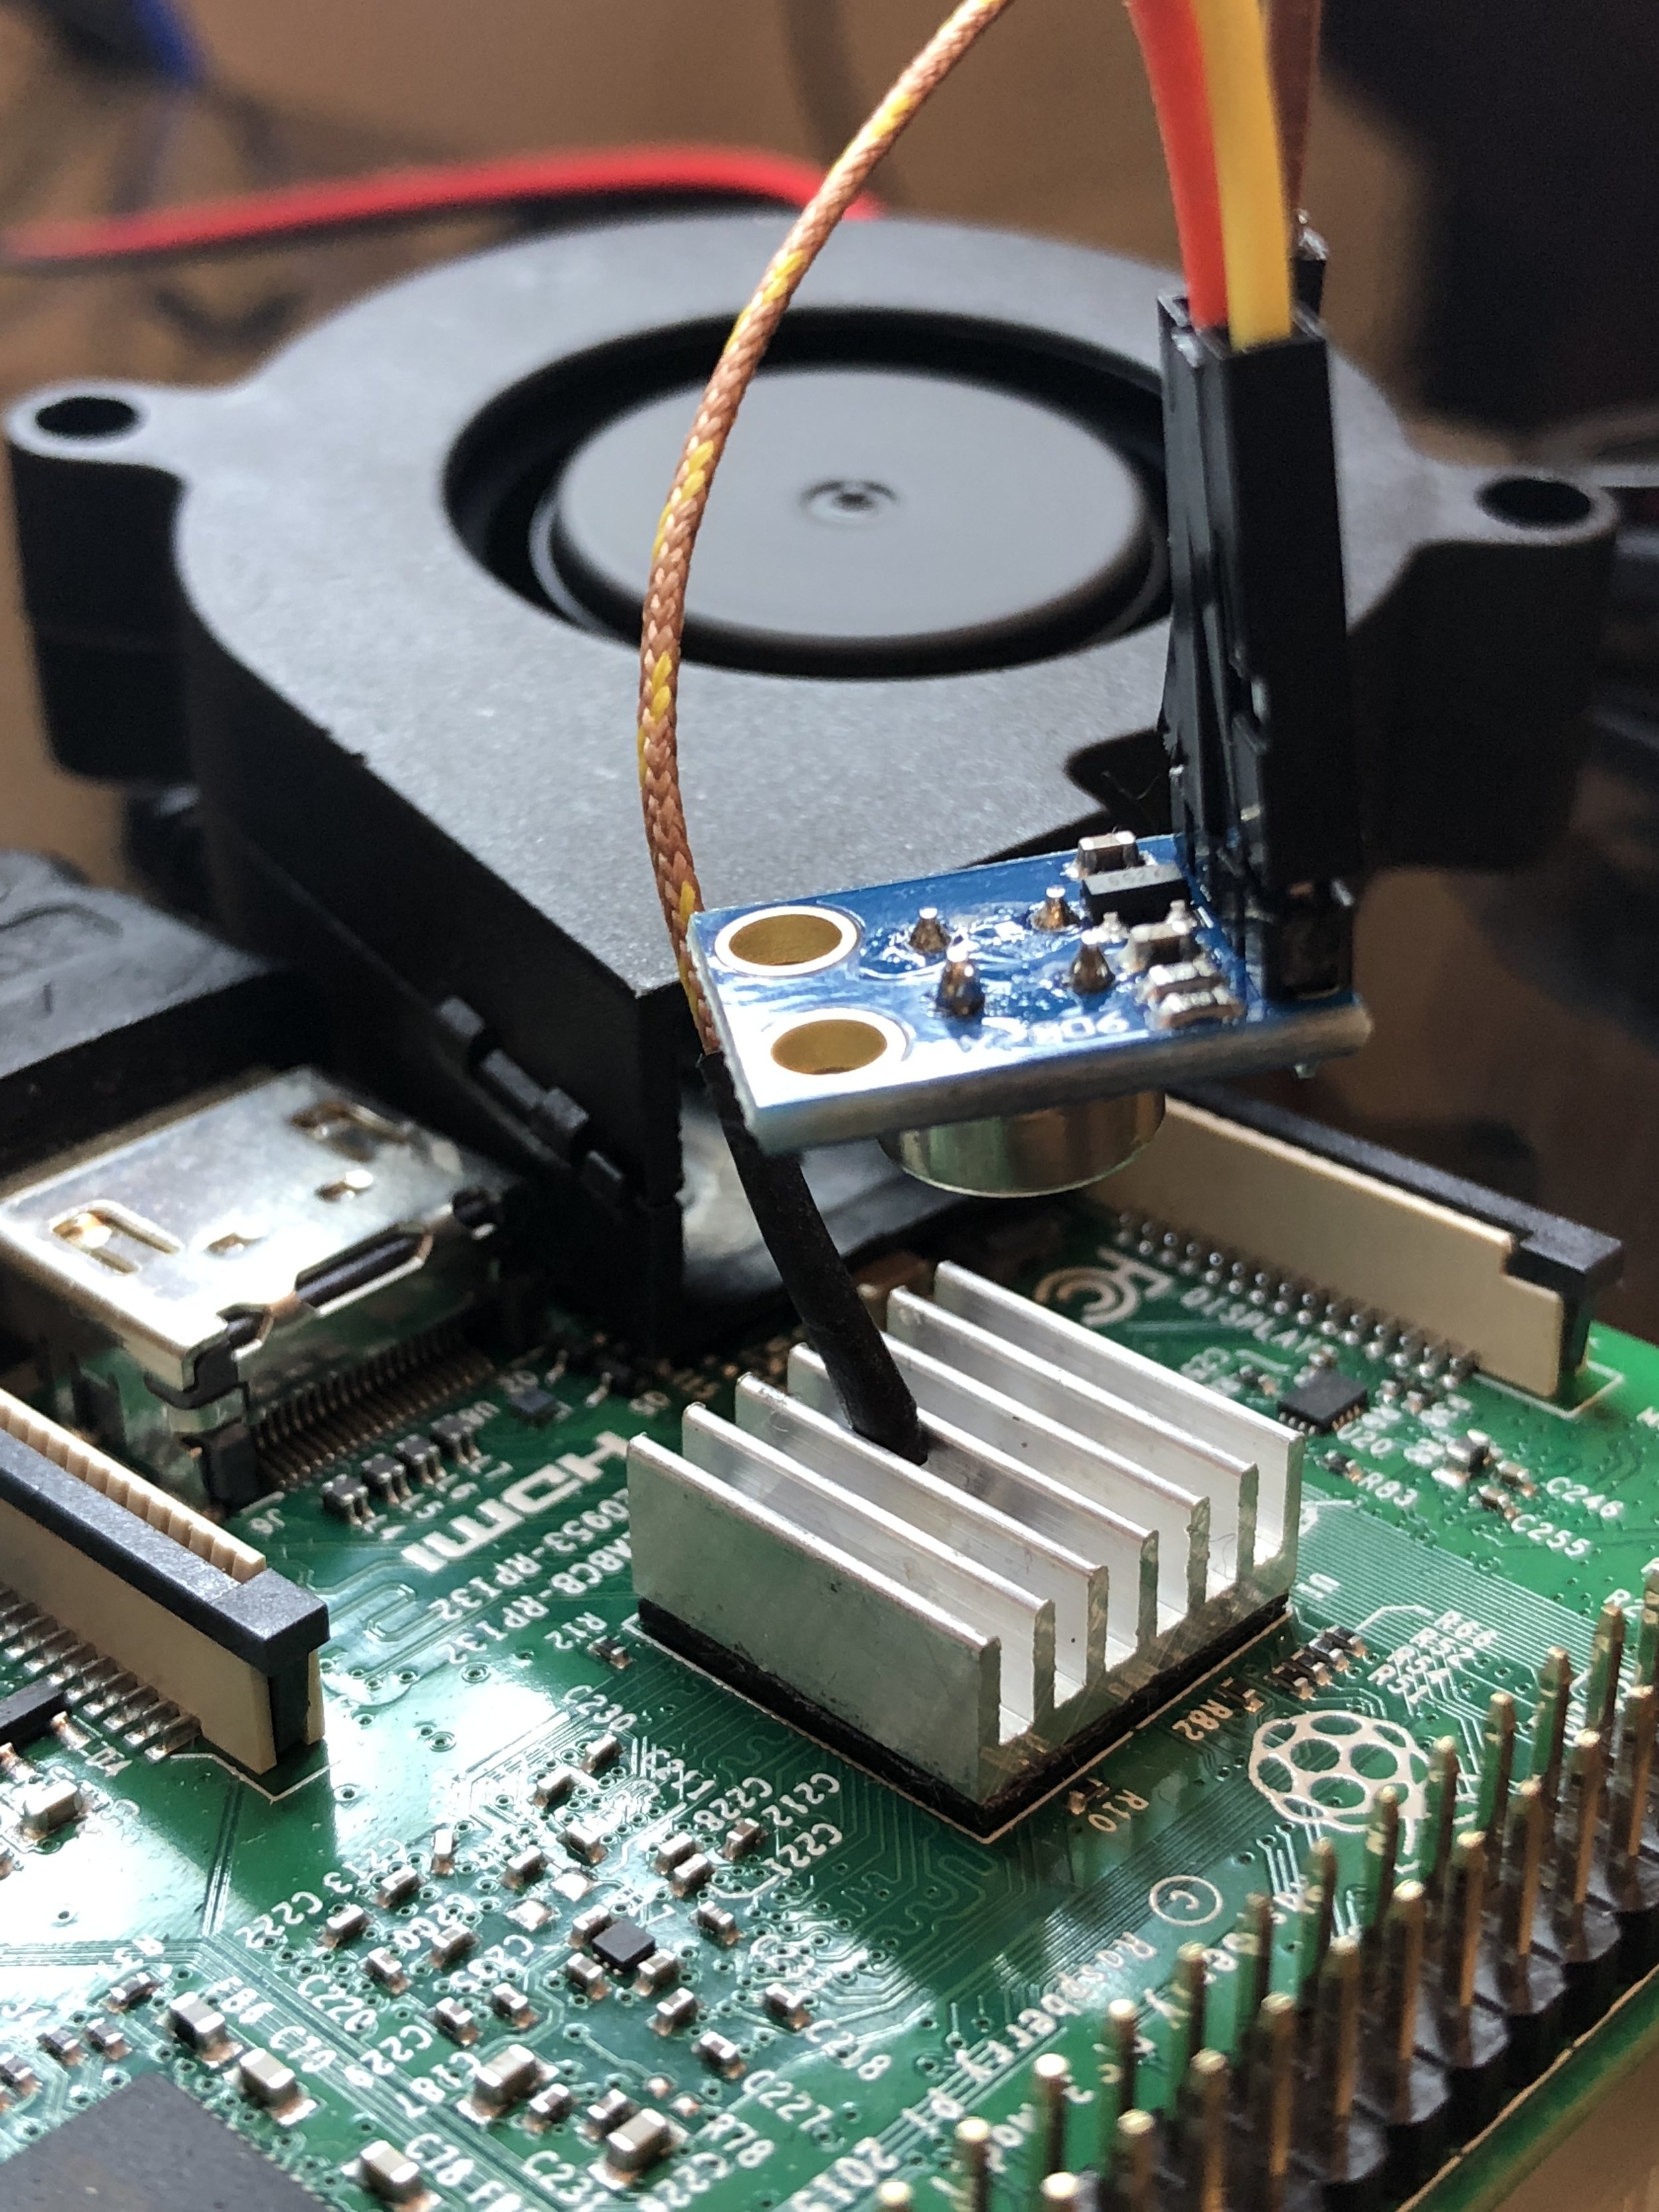
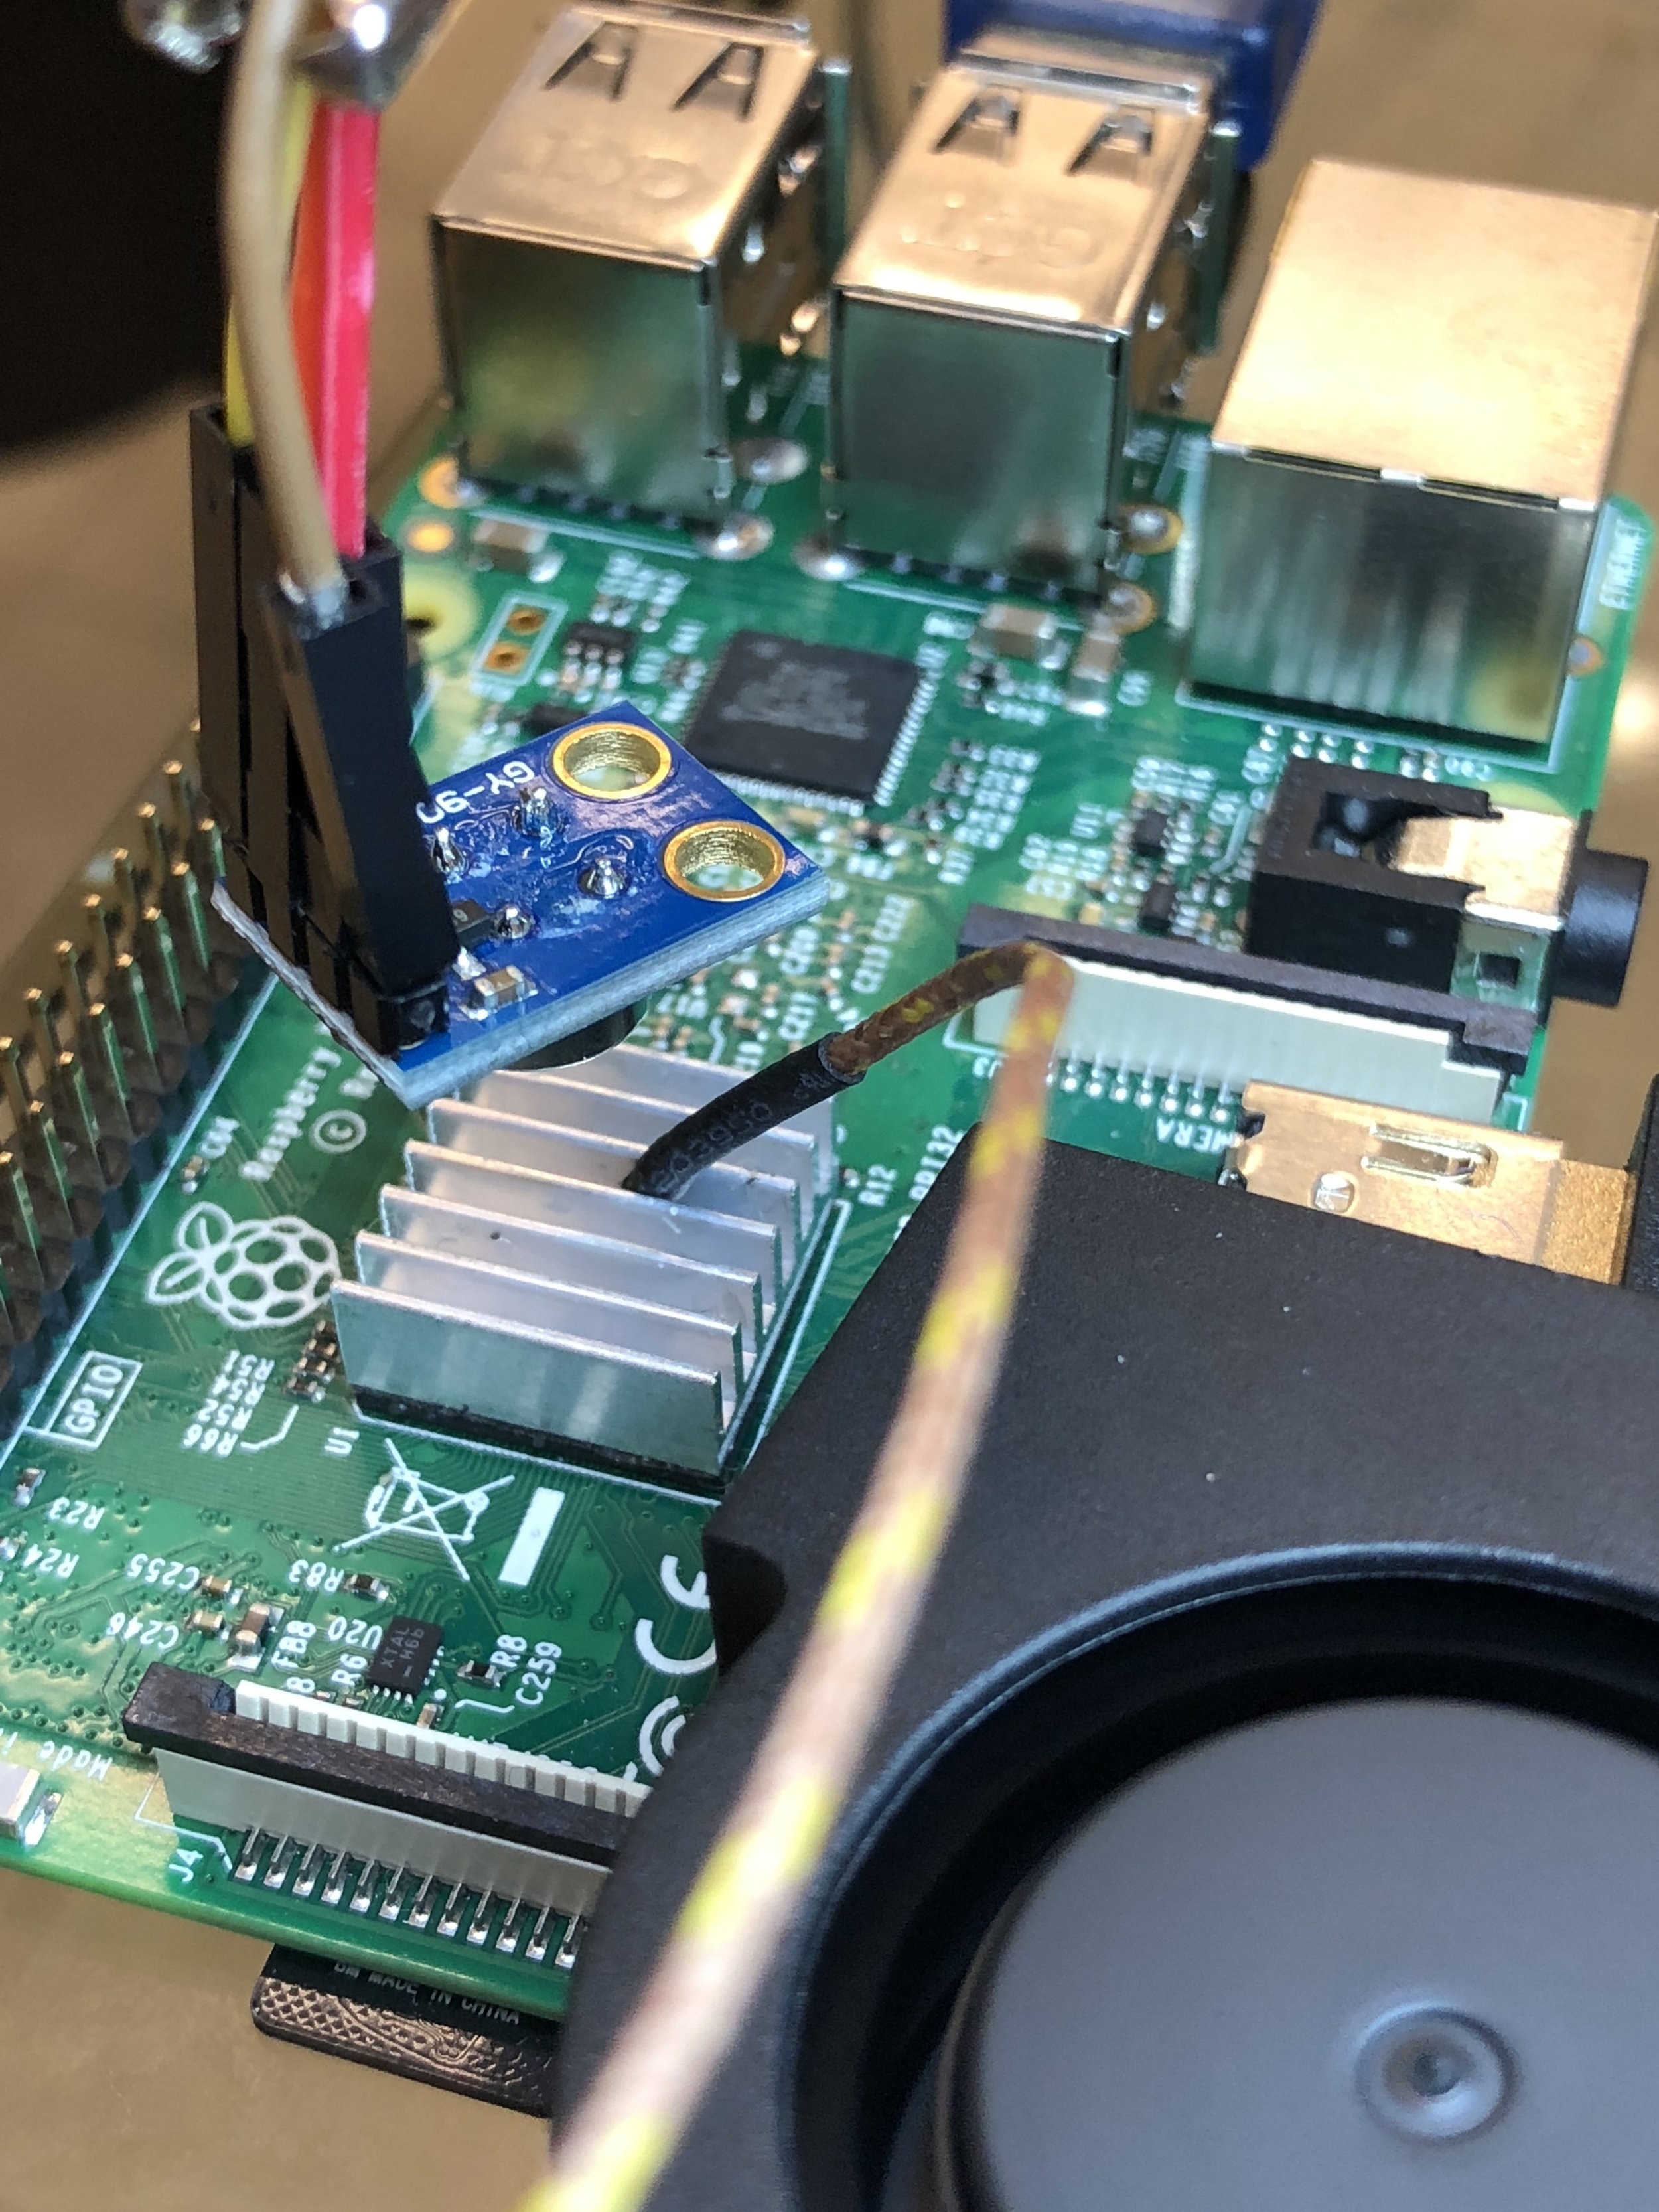
Figure 3 (below): My setup for the IR thermometer, type-k thermocouple, DC fan, and Raspberry Pi measurements.
Arduino Programming
This experiment relies heavily on 3rd party libraries from Adafruit and Sparkfun. The MAX6675 needs Adafruit's library located on GitHub, here. The IR thermometer (MLX90614) needs Sparkfun's library also located on GitHub, here. You can find a great tutorial on the MLX90614 here as well, if interested. I combined the examples from each library and outputted the values to the serial port to allow Python to read the values on the Raspberry Pi end.
NOTE on IR Thermometer: I am using two surfaces with the infrared thermometer. The first is the ceramic casing of the RPi CPU, and the second is an aluminum heat sink. Below I listed the rough experimental values for emissivity of each material. I will note that the emissivity for the heat sink was not quite accurate, but this may be something that I will investigate in the future. There is a noticeable separation between thermocouple and IR thermometer during the heat sink experiments. I believe this is due to the thermometer measuring the entire heat sink and the thermocouple was measuring only the base of the heat sink. I also think the emissivity is likely around 0.2.
| Material | Emissivity |
|---|---|
| Ceramic (CPU) | 0.90-0.94 |
| Aluminum (heat sink) | 0.09-0.86 |
#include "max6675.h" // import the MAX library
#include <Wire.h> // I2C library, needed for IR (MLX90614)
#include <SparkFunMLX90614.h> // SparkFunMLX90614 Arduino library

IRTherm therm; // Create an IRTherm object for IR thermometer

int thermoDO = 4; // SO
int thermoCS = 5; // CS
int thermoCLK = 6; // SCK

MAX6675 thermocouple(thermoCLK, thermoCS, thermoDO);

int vccPin = 3; //VCC
int gndPin = 2; //GND

float newEmissivity = 0.9; // for IC ceramic: 0.9-0.94, Al heat sink (anodized): 0.09-0.86

void setup()
{
  Serial.begin(9600); // Initialize Serial to log output
  therm.begin(); // Initialize thermal IR sensor
  therm.setUnit(TEMP_C); // Set the library's units to Celsius
  pinMode(vccPin, OUTPUT); digitalWrite(vccPin, HIGH); // Initializing VCC output
  pinMode(gndPin, OUTPUT); digitalWrite(gndPin, LOW); // Initializing GND pin on MAX6675
  therm.setEmissivity(newEmissivity); //Setting Emissivity
}

void loop()
{
  // Call therm.read() to read object and ambient temperatures from the sensor.
  if (therm.read()) // On success, read() will return 1, on fail 0.
  {
    Serial.print("IR: "+String(therm.object())+" TC: ");
    delay(100); // Putting some time between sensor measurements to allow Arduino to handle both
    Serial.println(thermocouple.readCelsius());
  }
}
Python Serial Read Loop
Now that the Arduino is outputting values to the serial port, we want to read the data on the Raspberry Pi end. The Python code below parses grabs data from the serial port and saves the values to a CSV file. Along with the IR temperature and thermocouple datapoints, I have added a timestamp and the RPi's internal temperature reading. The resulting CSV file contains four columns: timestamp, infrared temperature reading, thermocouple temperature reading, and the internal RPi temperature reading.
## Script to Interface with Arduino's Serial Port
#
#
import serial, csv, os, time
from datetime import datetime
from struct import *

jj=0

ser = serial.Serial('/dev/ttyACM0') # location of arduino port
# - see Tools->Serial Port ->/dev/ttyACM0 or whatever yours may say
time_now = datetime.now()

filename = 'data_'+str(time_now.year)+'_'+str(time_now.month)+'_'+\
           str(time_now.day)+'_'+str(time_now.hour)+'_'+str(time_now.minute)+'.csv'

with open(filename,'w') as data_file:

    csv_writer = csv.writer(data_file)

    while 1:
        line_raw = ser.readline()
        if line_raw[0:4]==b'IR: ':
            try:
                float(line_raw[4:9])
                float(line_raw[14:19])
                if float(line_raw[4:9])<0:
                    continue
            except:
                continue
            ir_val = line_raw[4:9].decode('utf-8')
            tc_val = line_raw[14:19].decode('utf-8')
            core_readline = os.popen("vcgencmd measure_temp").readline()
            core_val = core_readline[5:9]
            print("IR: %s, TC: %s, Core: %s" % (ir_val,tc_val,core_val))
            if jj==1:
                csv_writer.writerow([time.time(),float(ir_val),float(tc_val),float(core_val)])
            jj=1
With the above code, you can produce CSV files that contain real-time data that will allow you to plot heat transfer data from the RPi. The video above shows the characteristic output form the Python script. Now that the wiring and coding end is complete, I will cover my stress procedure for the RPi so that we can investigate several operating conditions (within normal operation) and increase the chip's heat generation.
RPi Stress Procedure
I chose to stress the RPi by running multiple Python programs simultaneously with endless while loops. This procedure mimics normal operating conditions on the Pi (assuming stable Python scripting), and produced four levels of CPU exertion. The 5-cycle procedure is shown below:
Stress Procedure:
- 5%-7% CPU for 120 seconds
- 28%-29% CPU for 120 seconds (1 stress loop)
- 54%-57% CPU for 120 seconds (2 stress loops)
- 80%-82% CPU for 120 seconds (3 stress loops)
- 5%-7% CPU for 120 seconds
Stress loop used in Python:
ii = 0
while 1:
    ii+=1
    if ii==10000:
        ii = 0

Figure 4: CPU percentages shown in a temperature plot, indicating the correlation between CPU and heat generation.
I'm not sure whether the Pi has a background optimization routine that would automatically limit CPU usage, and therefore it is not clear to me whether the CPU percentage is indicative of the true exertion of the CPU. But the simultaneous run of several loops like the one above exhibited increased usage of the CPU chip, so I assumed the CPU would heat up with each loop. And judging by the temperatures recorded below - this was an accurate assumption to a certain degree.
A Little Heat Transfer Theory
In order to understand the cooling process it is necessary to understand convection and the heat transfer for a flat plate. Convection is the ambient cooling process that allows the chip to maintain its temperature relative to its surroundings. In our first case (no fan or heat sink), we can assume the chip is only being cooled via natural convection. If you open a heat transfer textbook and investigate natural convection, the heat flux for a surface held at a constant temperature can be written as:
Where qs is the heat flux, h is the heat transfer coefficient (usually between 3-10 for natural convection indoors),Ts is the surface temperature, and T∞ is the ambient temperature.
Now, for a forced convection case under laminar flow, we would have heat transfer under the following conditions:
Where qs again is the heat flux, k is the thermal conductivity of the fluid (air), NuL is the Nusselt number (explained below), Ts again is the surface temperature, T∞ is the ambient temperature, and L is the length of the flat plate (microchip).
What we want from this theory is to predict the cooling effects of our fan. In order to do that, we must first relate the natural convective heat flux to the forced convective situation:
And since we want the temperature of the plate after cooling, we solve for Ts:
Now, if you're not familiar with heat transfer the NuL number is likely somehwat of a mystery. It is used to relate convection and conduction to create a heat transfer coefficient for forced convection. In our case, we will need the Nusselt number that accounts for a non-heated entrance region, which is written in terms of the Reynold's and Prandtl numbers and a few geometrical constants:
This gives us the (somewhat ugly) result for surface temperature prediction for the Raspberry Pi's CPU:
This result is profound in our particular case because it states that: measurements of CPU under natural convection, information about the geometry of the surface, properties of air in the specific case, and the velocity of the cooling fan can help us predict the surface temperature of the chip being cooled by the fan!
Heat Transfer Results
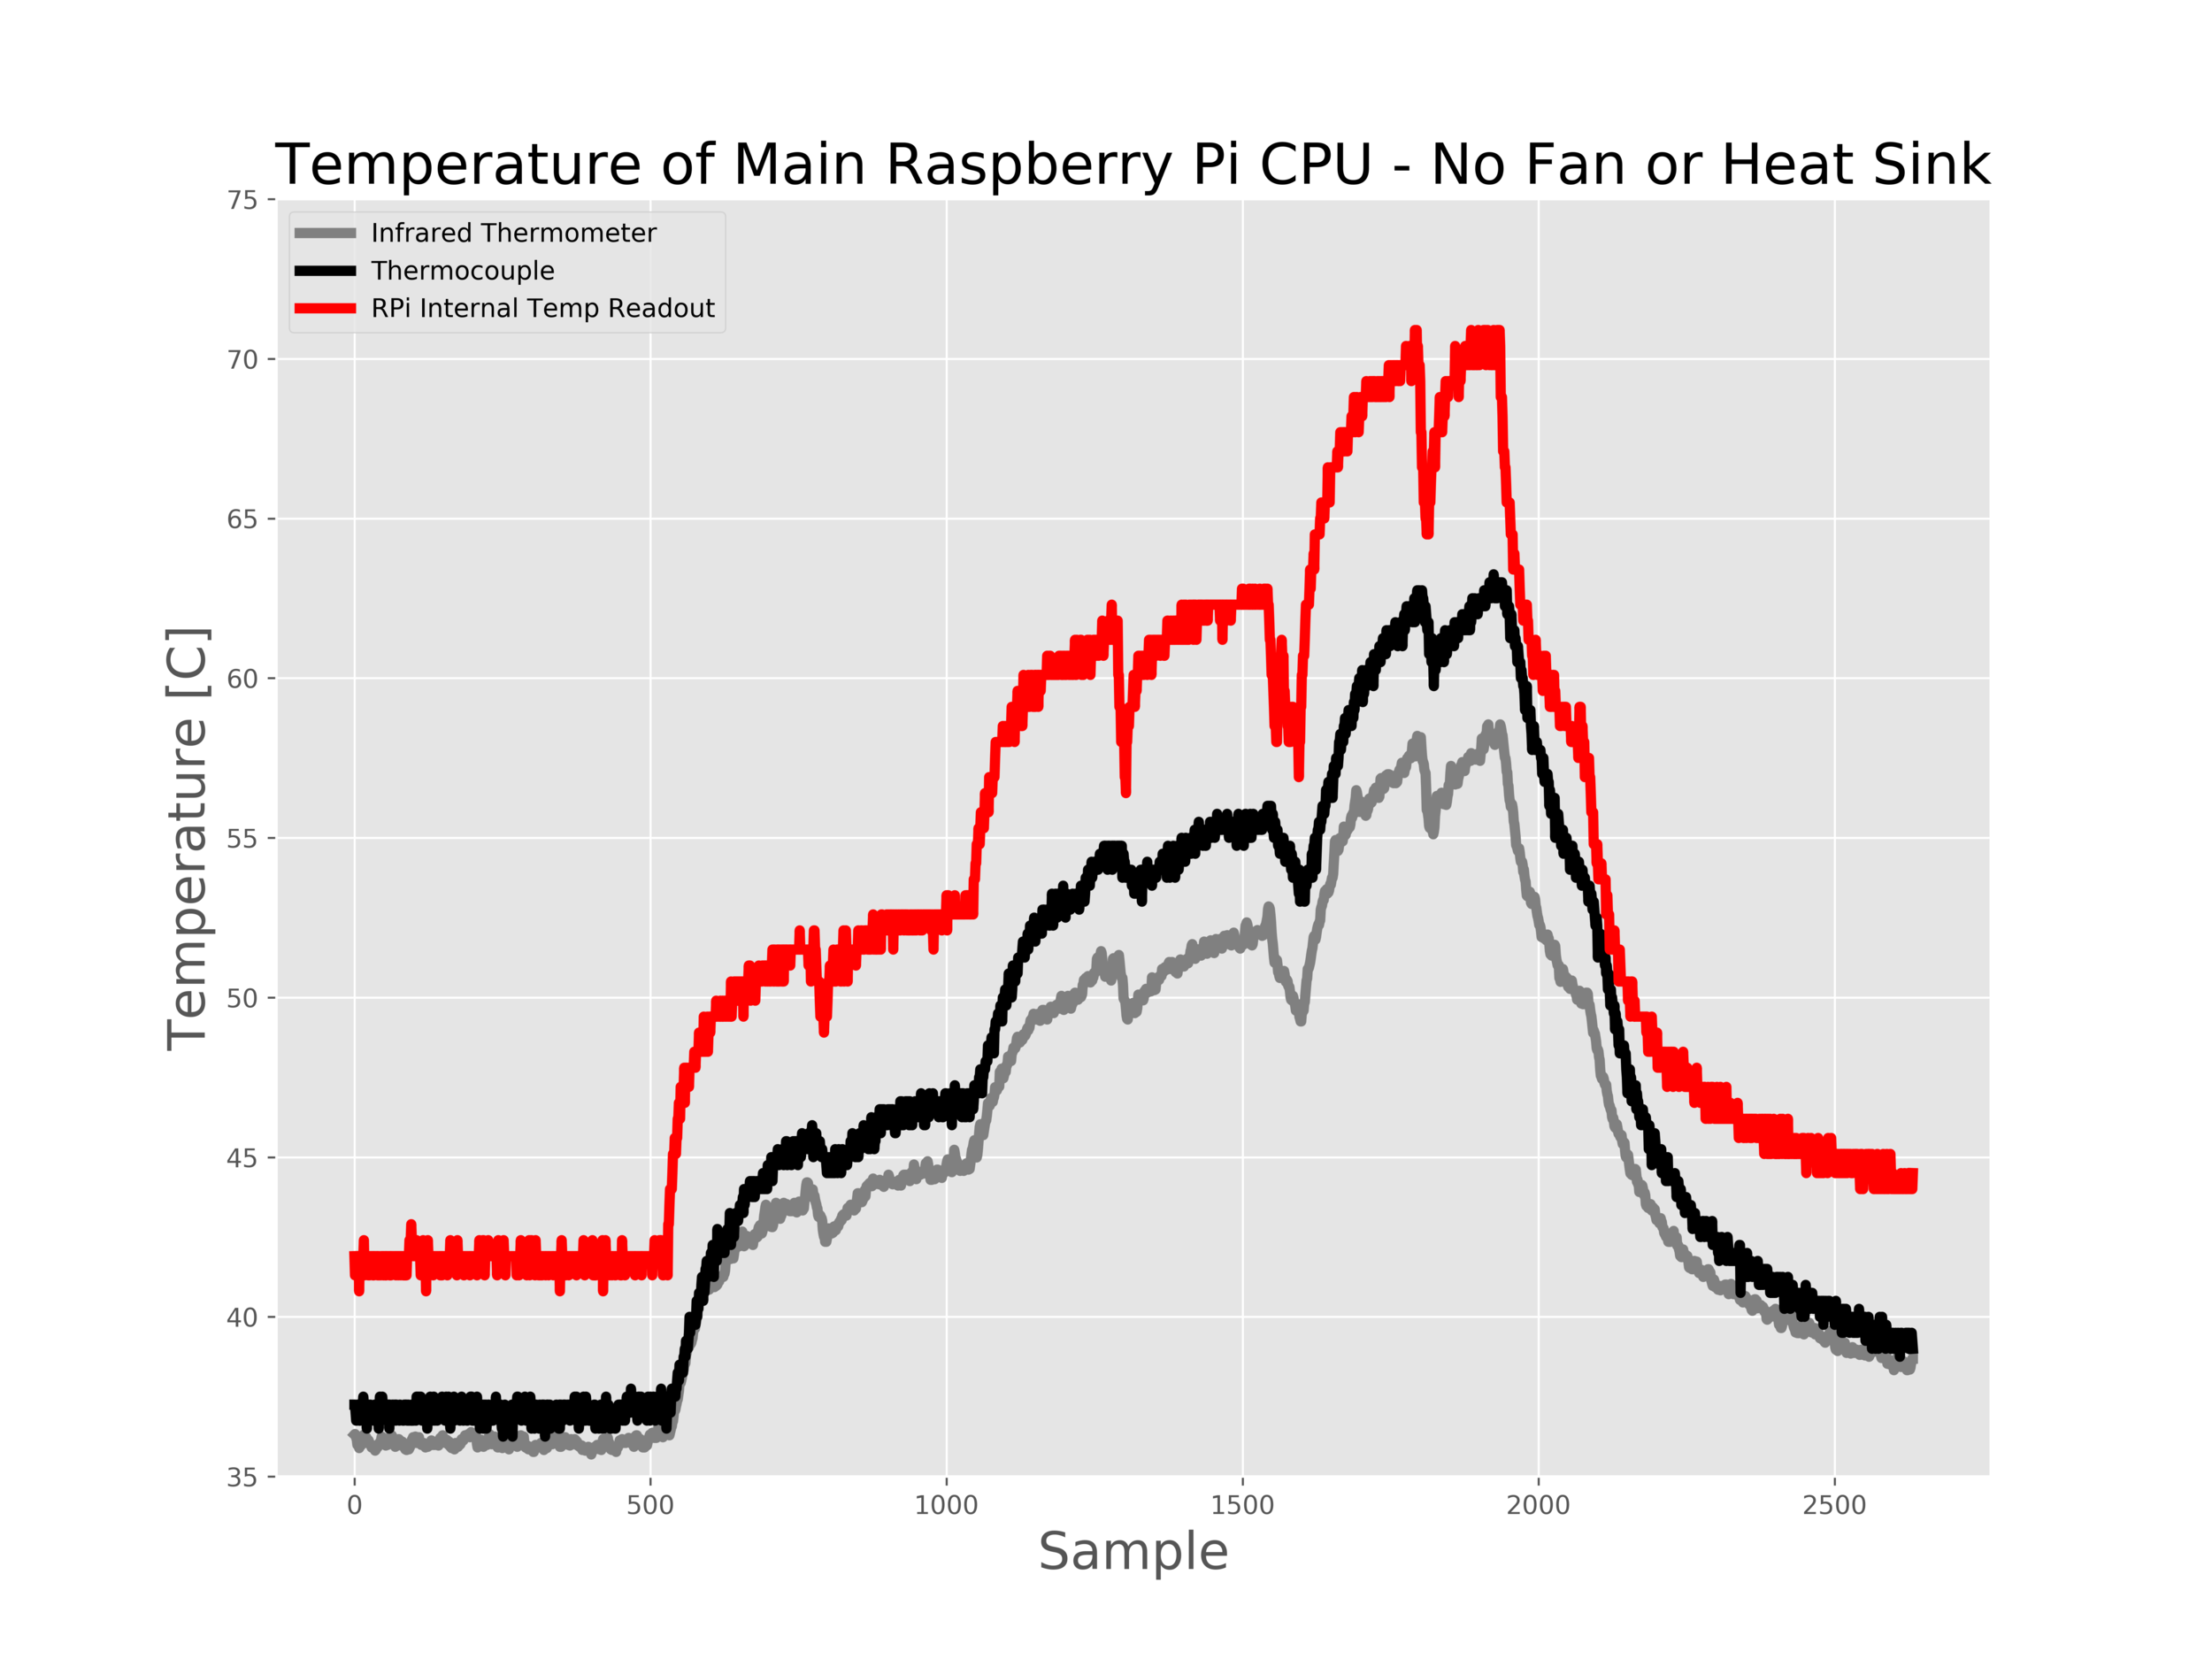
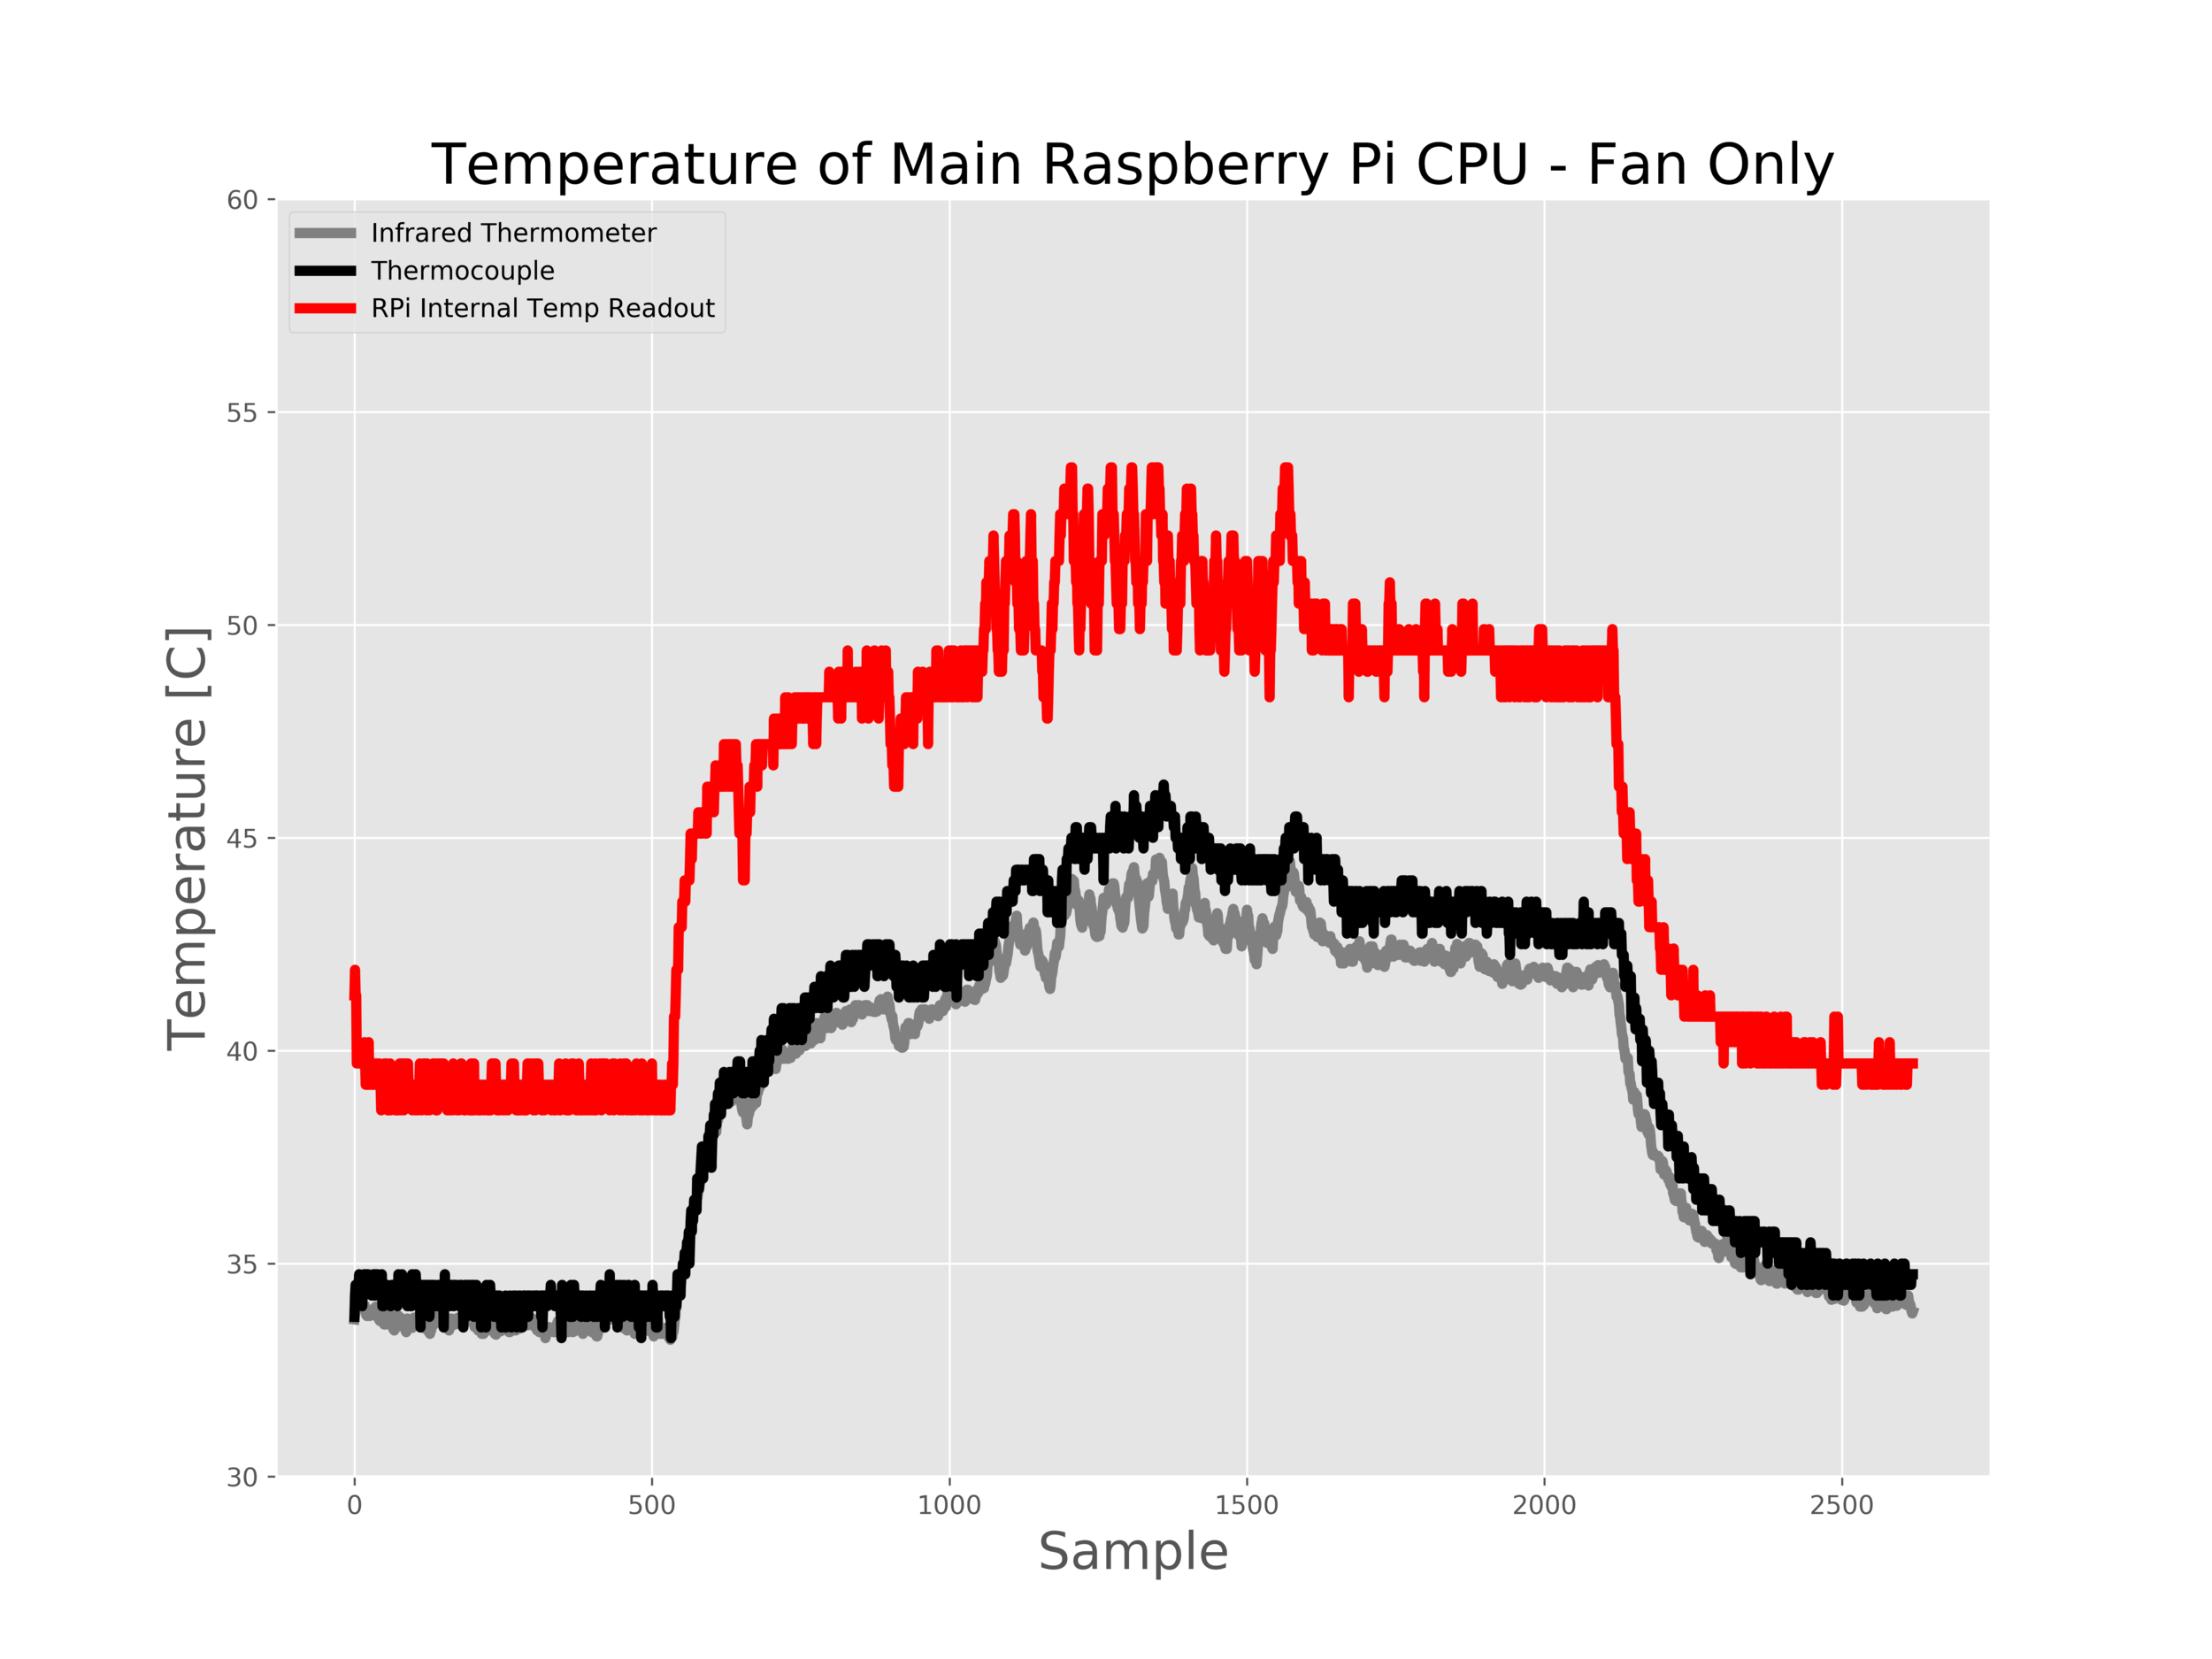
Now that I have described the experimental setup and introduced some simple heat transfer concepts, it is time to analyze the data. Below in Figure 5 are my measurements of the CPU temperature for three cases: no fan or heat sink, fan only, and fan and heat sink. For the heat transfer analysis, I will only be focusing on the 'no fan or heat sink' and 'fan only' cases.
After taking the values for surface temperature from the figure above, we can begin our heat transfer analysis. In the table below, I have outline the state variables (taken from engineeringtoolbox.com) used in my calculations under my specific experimental conditions.
Using the values above, we can now construct a prediction using the equation for Ts. In my case, I found that hnc = 13 was the most accurate heat transfer coefficient under natural convection. This aligns with experimentally-held results. Below is the surface temperature prediction using only the temperature data from the thermocouple without a fan or heat sink and the heat transfer equation above.

Figure 6: Using the heat transfer approach, the predicted performance of the fan is closely approximated for the lower power states, but struggles at the higher states. I believe this is because the Raspberry Pi is operating in such a way that it is able to optimize the CPU after being cooled by the fan. This would create the lower temperature shown in the Blue. My prediction (in Orange) follows the Green line because it is predicted from that data. I believe if the RPi was running identically on both runs, the Blue line would mimic the Orange, however, in this case it appears something else was happening with the CPU. The positive observation is that the return back to low power (the tail end of the data) follows nicely between Orange and Blue, indicating good agreement between the predicted heat transfer performance of the fan and the actual data taken from the fan-cooled CPU.
In Figure 6 above, it is easy to see that the heat transfer prediction does a good job at predicting the surface temperature for the first two periods (5% and 28% CPU), then struggles during the third (55%), completely fails on the fourth (80%), and then realigns during the fifth (5%) period. I believe this is due to internal CPU conditions that change based on the temperature of the chip. For example, if the chip begins heating excessively, the internal temperature sensor will flag the chip and cause it to alter its running procedures. In our case, the fan cooled the chip enough that it was able to run more efficiently (a theory of mine), so it didn't need to approach a higher percentage of CPU to work. This indicates that cooling the main chip actually improves the performance of the CPU overall, which is a great conclusion to be drawn despite the disagreement in heat transfer conclusion.
Conclusions
This experiment turned out to be lengthier than I had originally predicted. I began this experiment with the intention of comparing the MLX90614 and type-k thermocouple to investigate their relative calibration. However, I quickly realized that the experiment was more interesting as a heat transfer problem! I became more and more enthralled by the results from fan cooling as well as the heat sink, so I decided to continue investigating the problem. As a result, I was able to successfully predict the impact of the DC fan (under certain conditions) and create a qualitative understanding of the CPU heat generation. This type of experiment would be great for young college-aged engineers getting started with heat transfer and I may even introduce it into my own classes.
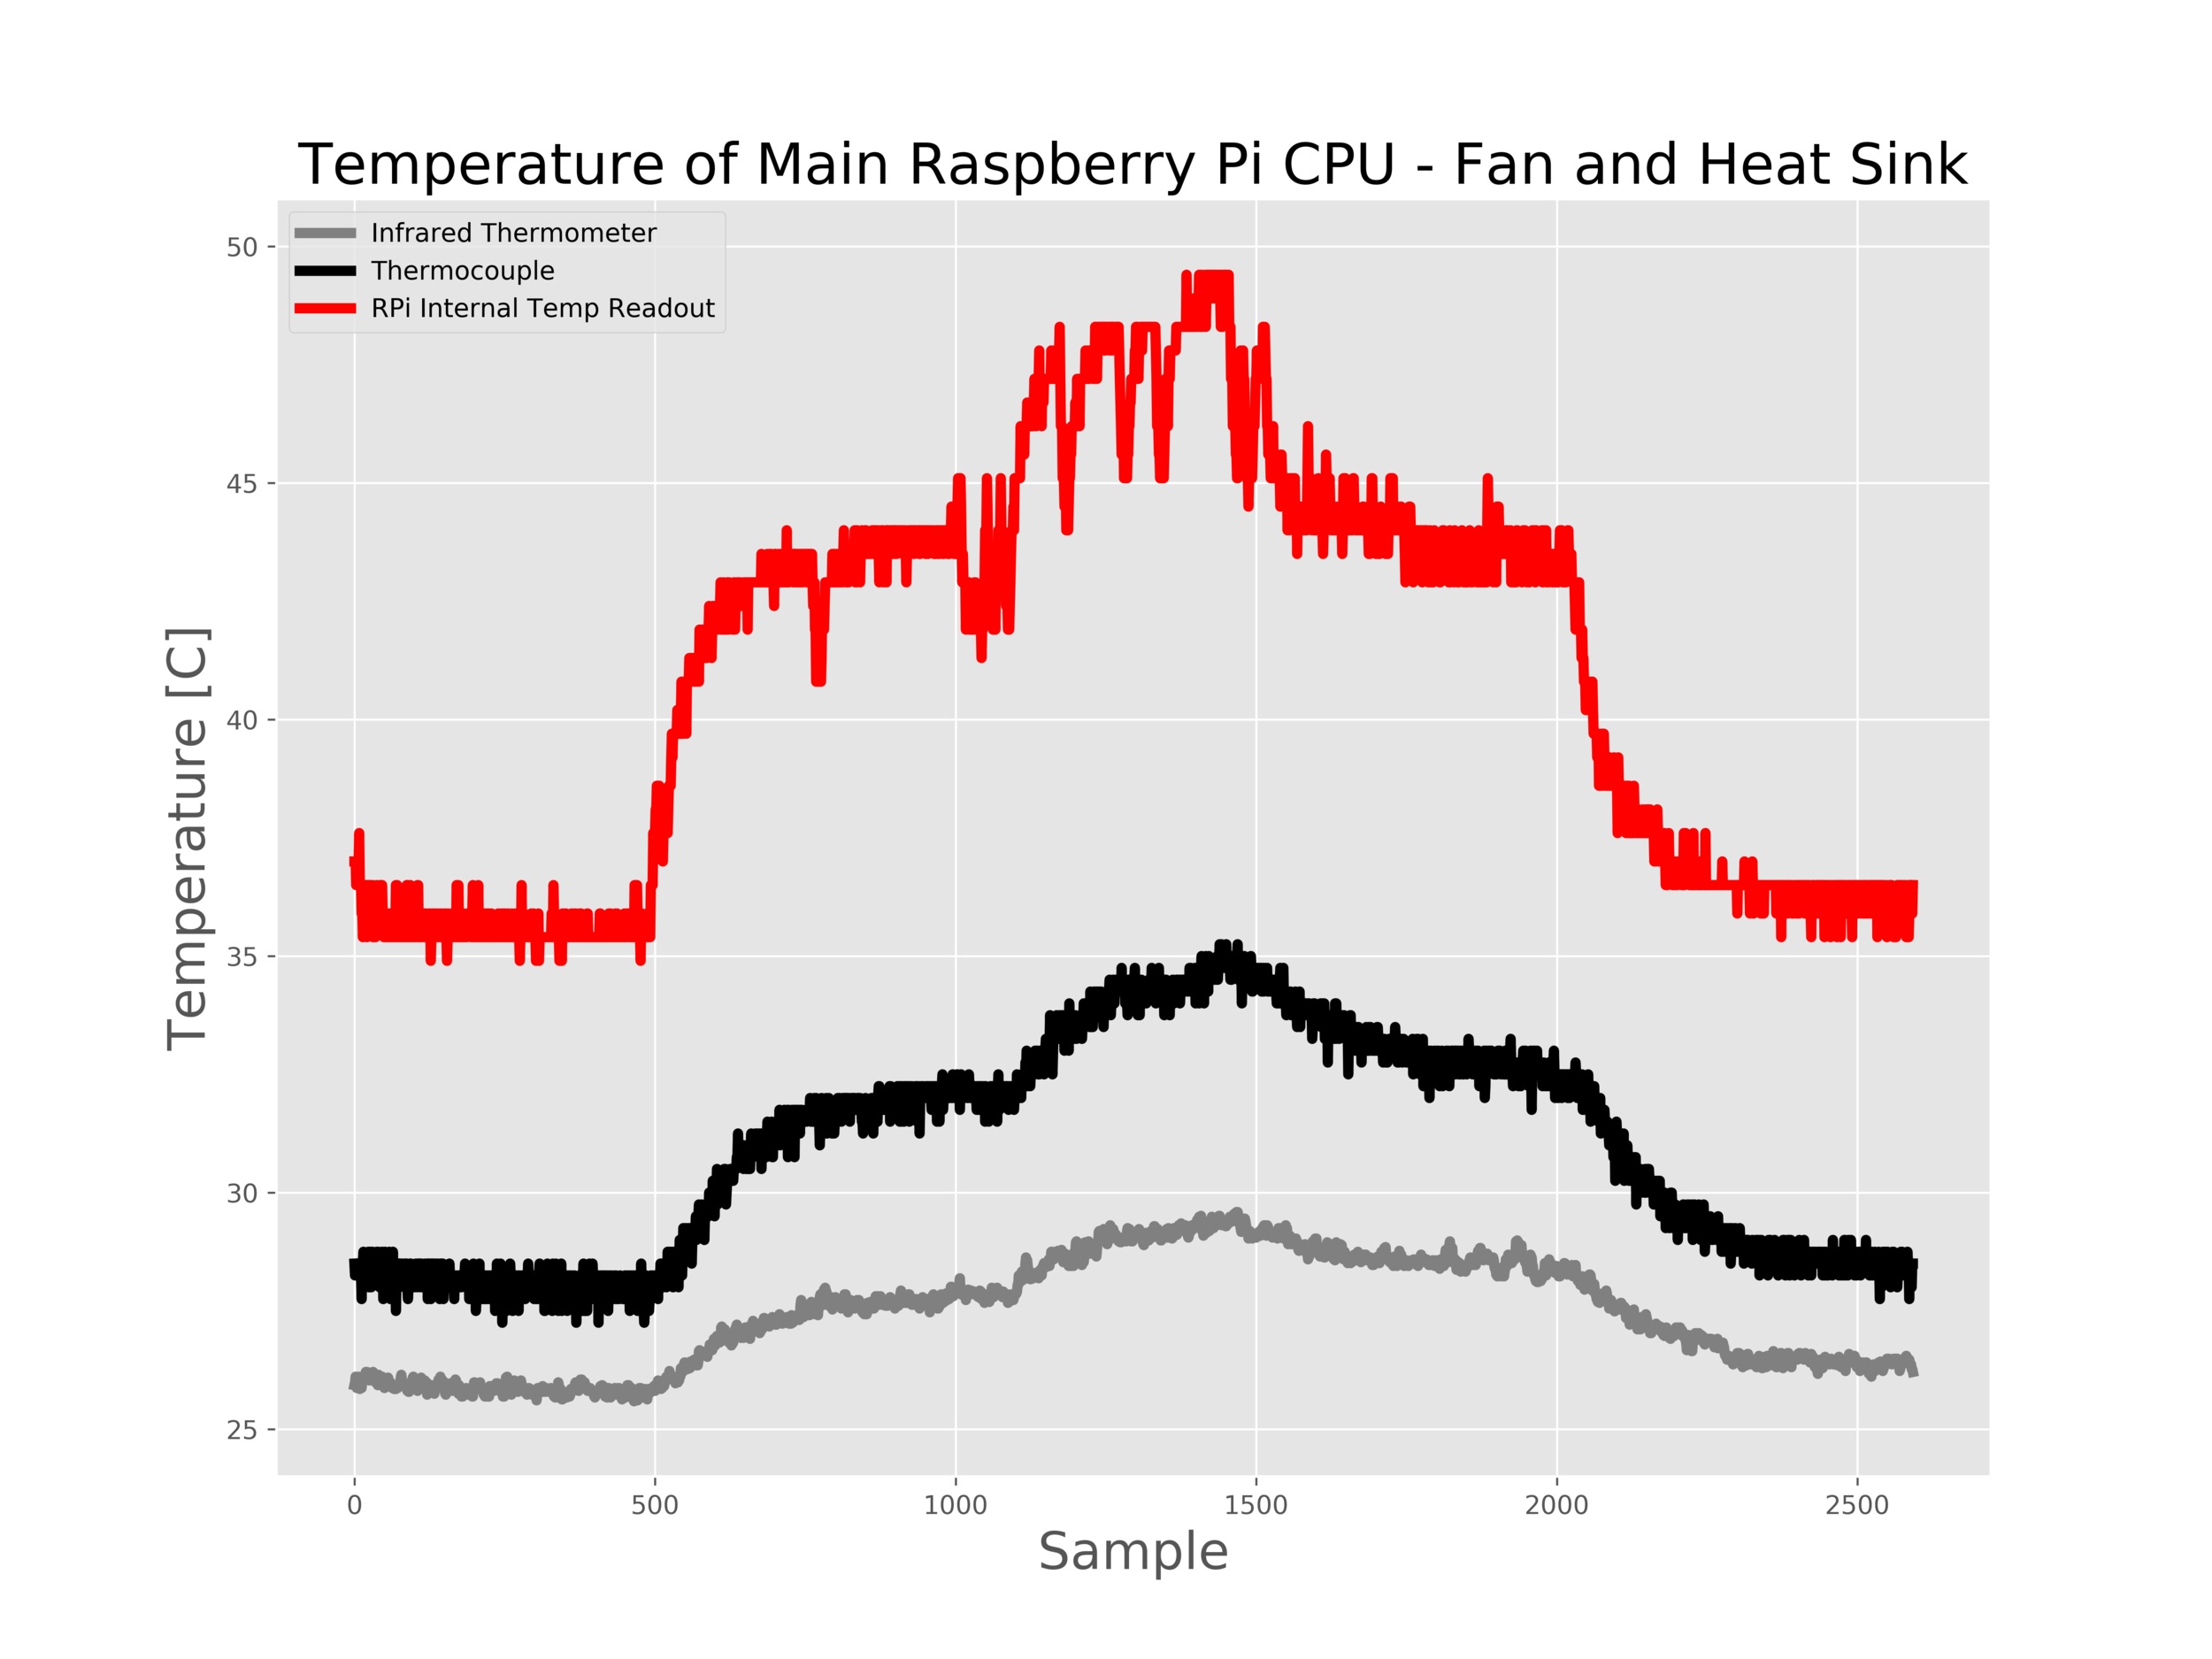
I did not discuss the heat sink at length in this article because it introduces a completely different (and more complex) set of heat transfer skills. But I did conclude that the heat sink under fan-cooled conditions had a huge impact on the surface temperature of the CPU. In the final figure, Figure 7, I have plotted all three sensors for all three cases of cooling. It is immediately obvious that the fan and heat sink combination result in a decrease in surface temperature by almost 10 degrees when compared to the fan-only situation and as much as a 40 degree temperature difference for no fan or heat sink case. What a result!

Figure 7: Results from the three cases of cooling: ambient convection, fan cooling, and fan-cooled heat sinking. These results indicate that introducing a fan can reduce the surface temperature of the CPU by a few degrees to almost 20 degrees Celsius. When a heat sink and fan are introduced, we see a huge reduction in surface temperature, ranging from 8 degrees to nearly 40 degrees! This indicates, along with other features in the plot, that the fan and heat sink combination could increase the life of the CPU by reducing the core temperature and perhaps even improving the efficiency of the chip by maintaining the surface temperature without the CPU need to worry about overheating.
See More in Engineering and Raspberry Pi: