Distance Detection with the TF-Luna LiDAR and Raspberry Pi
“As an Amazon Associates Program member, clicking on links may result in Maker Portal receiving a small commission that helps support future projects.”
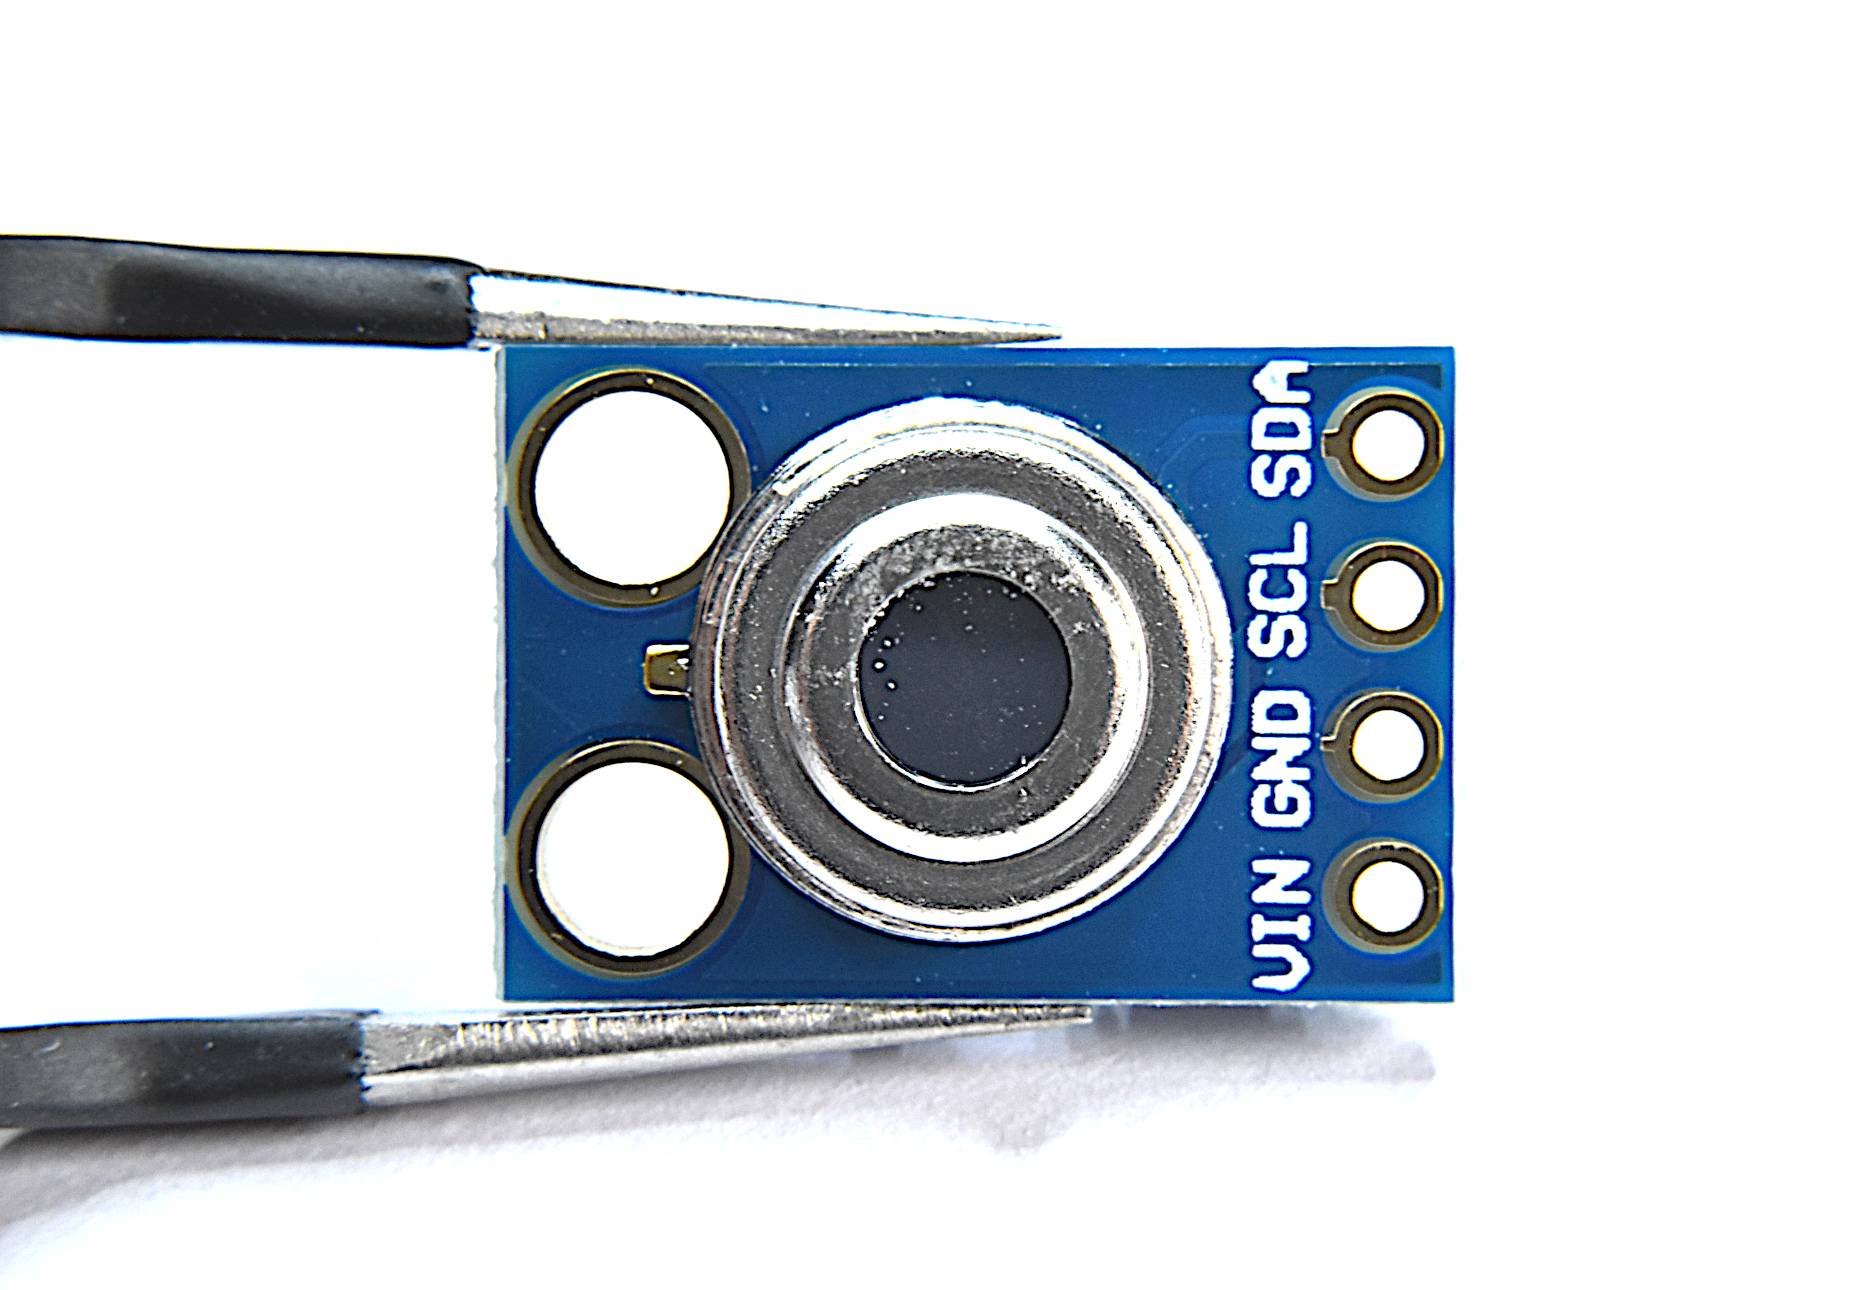
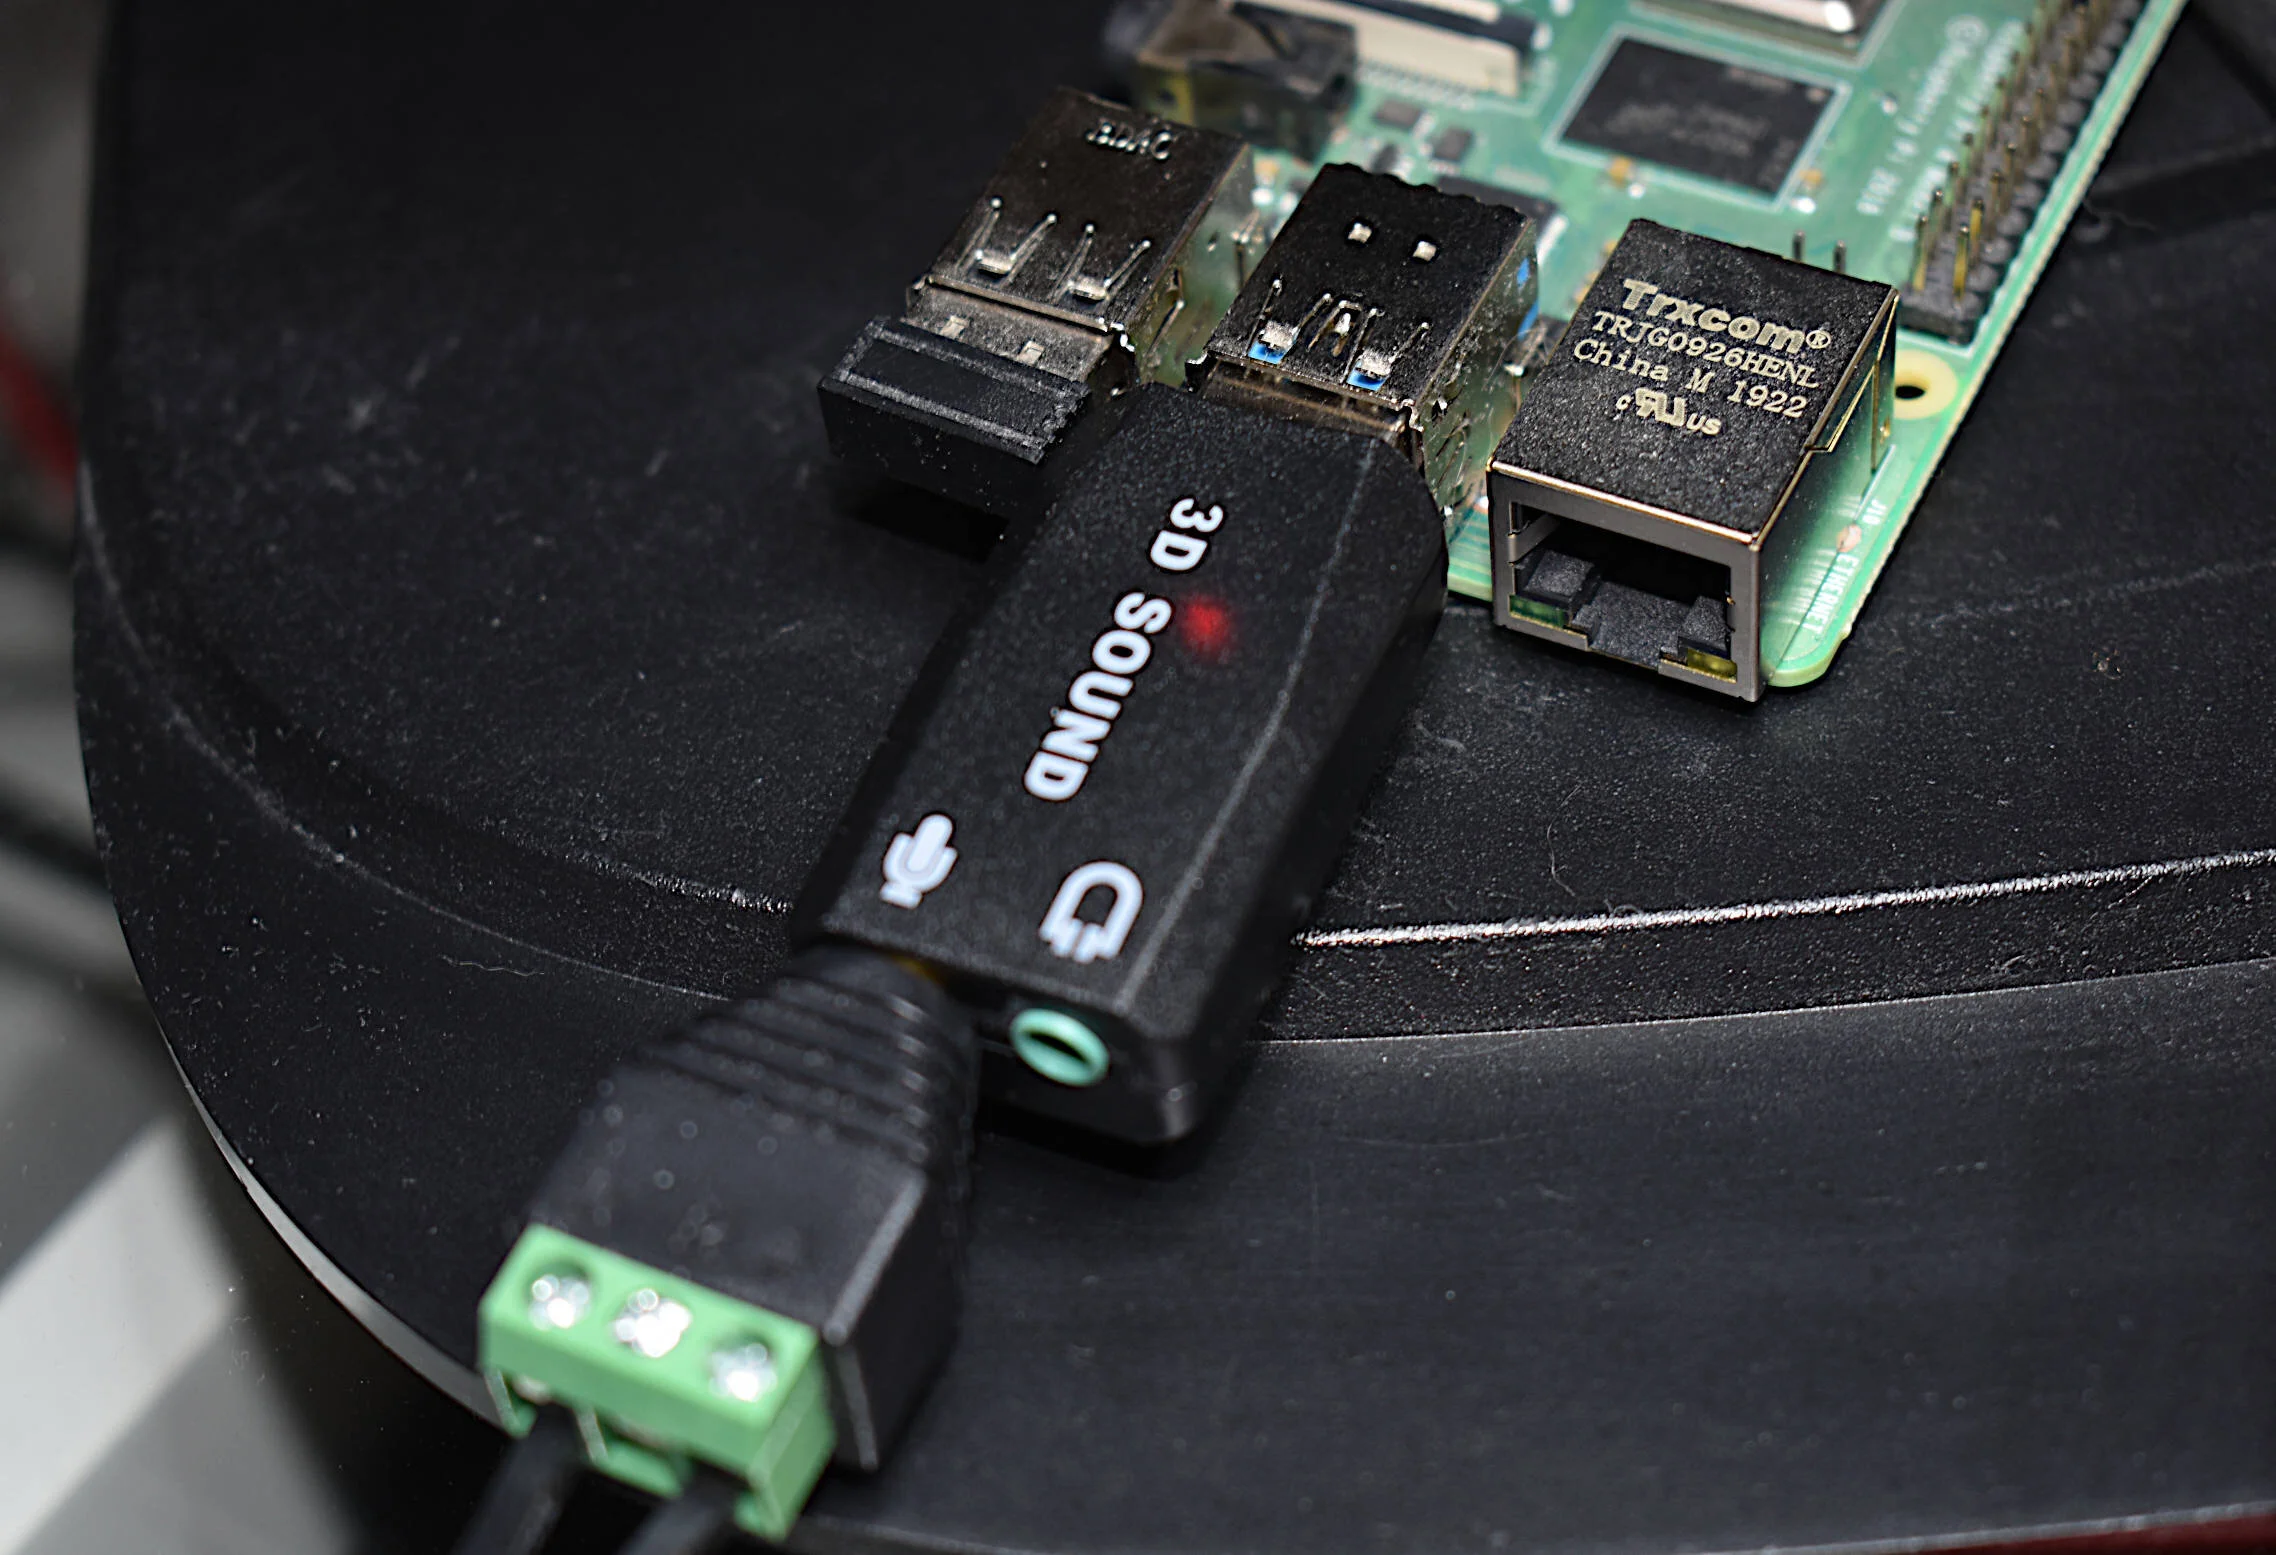
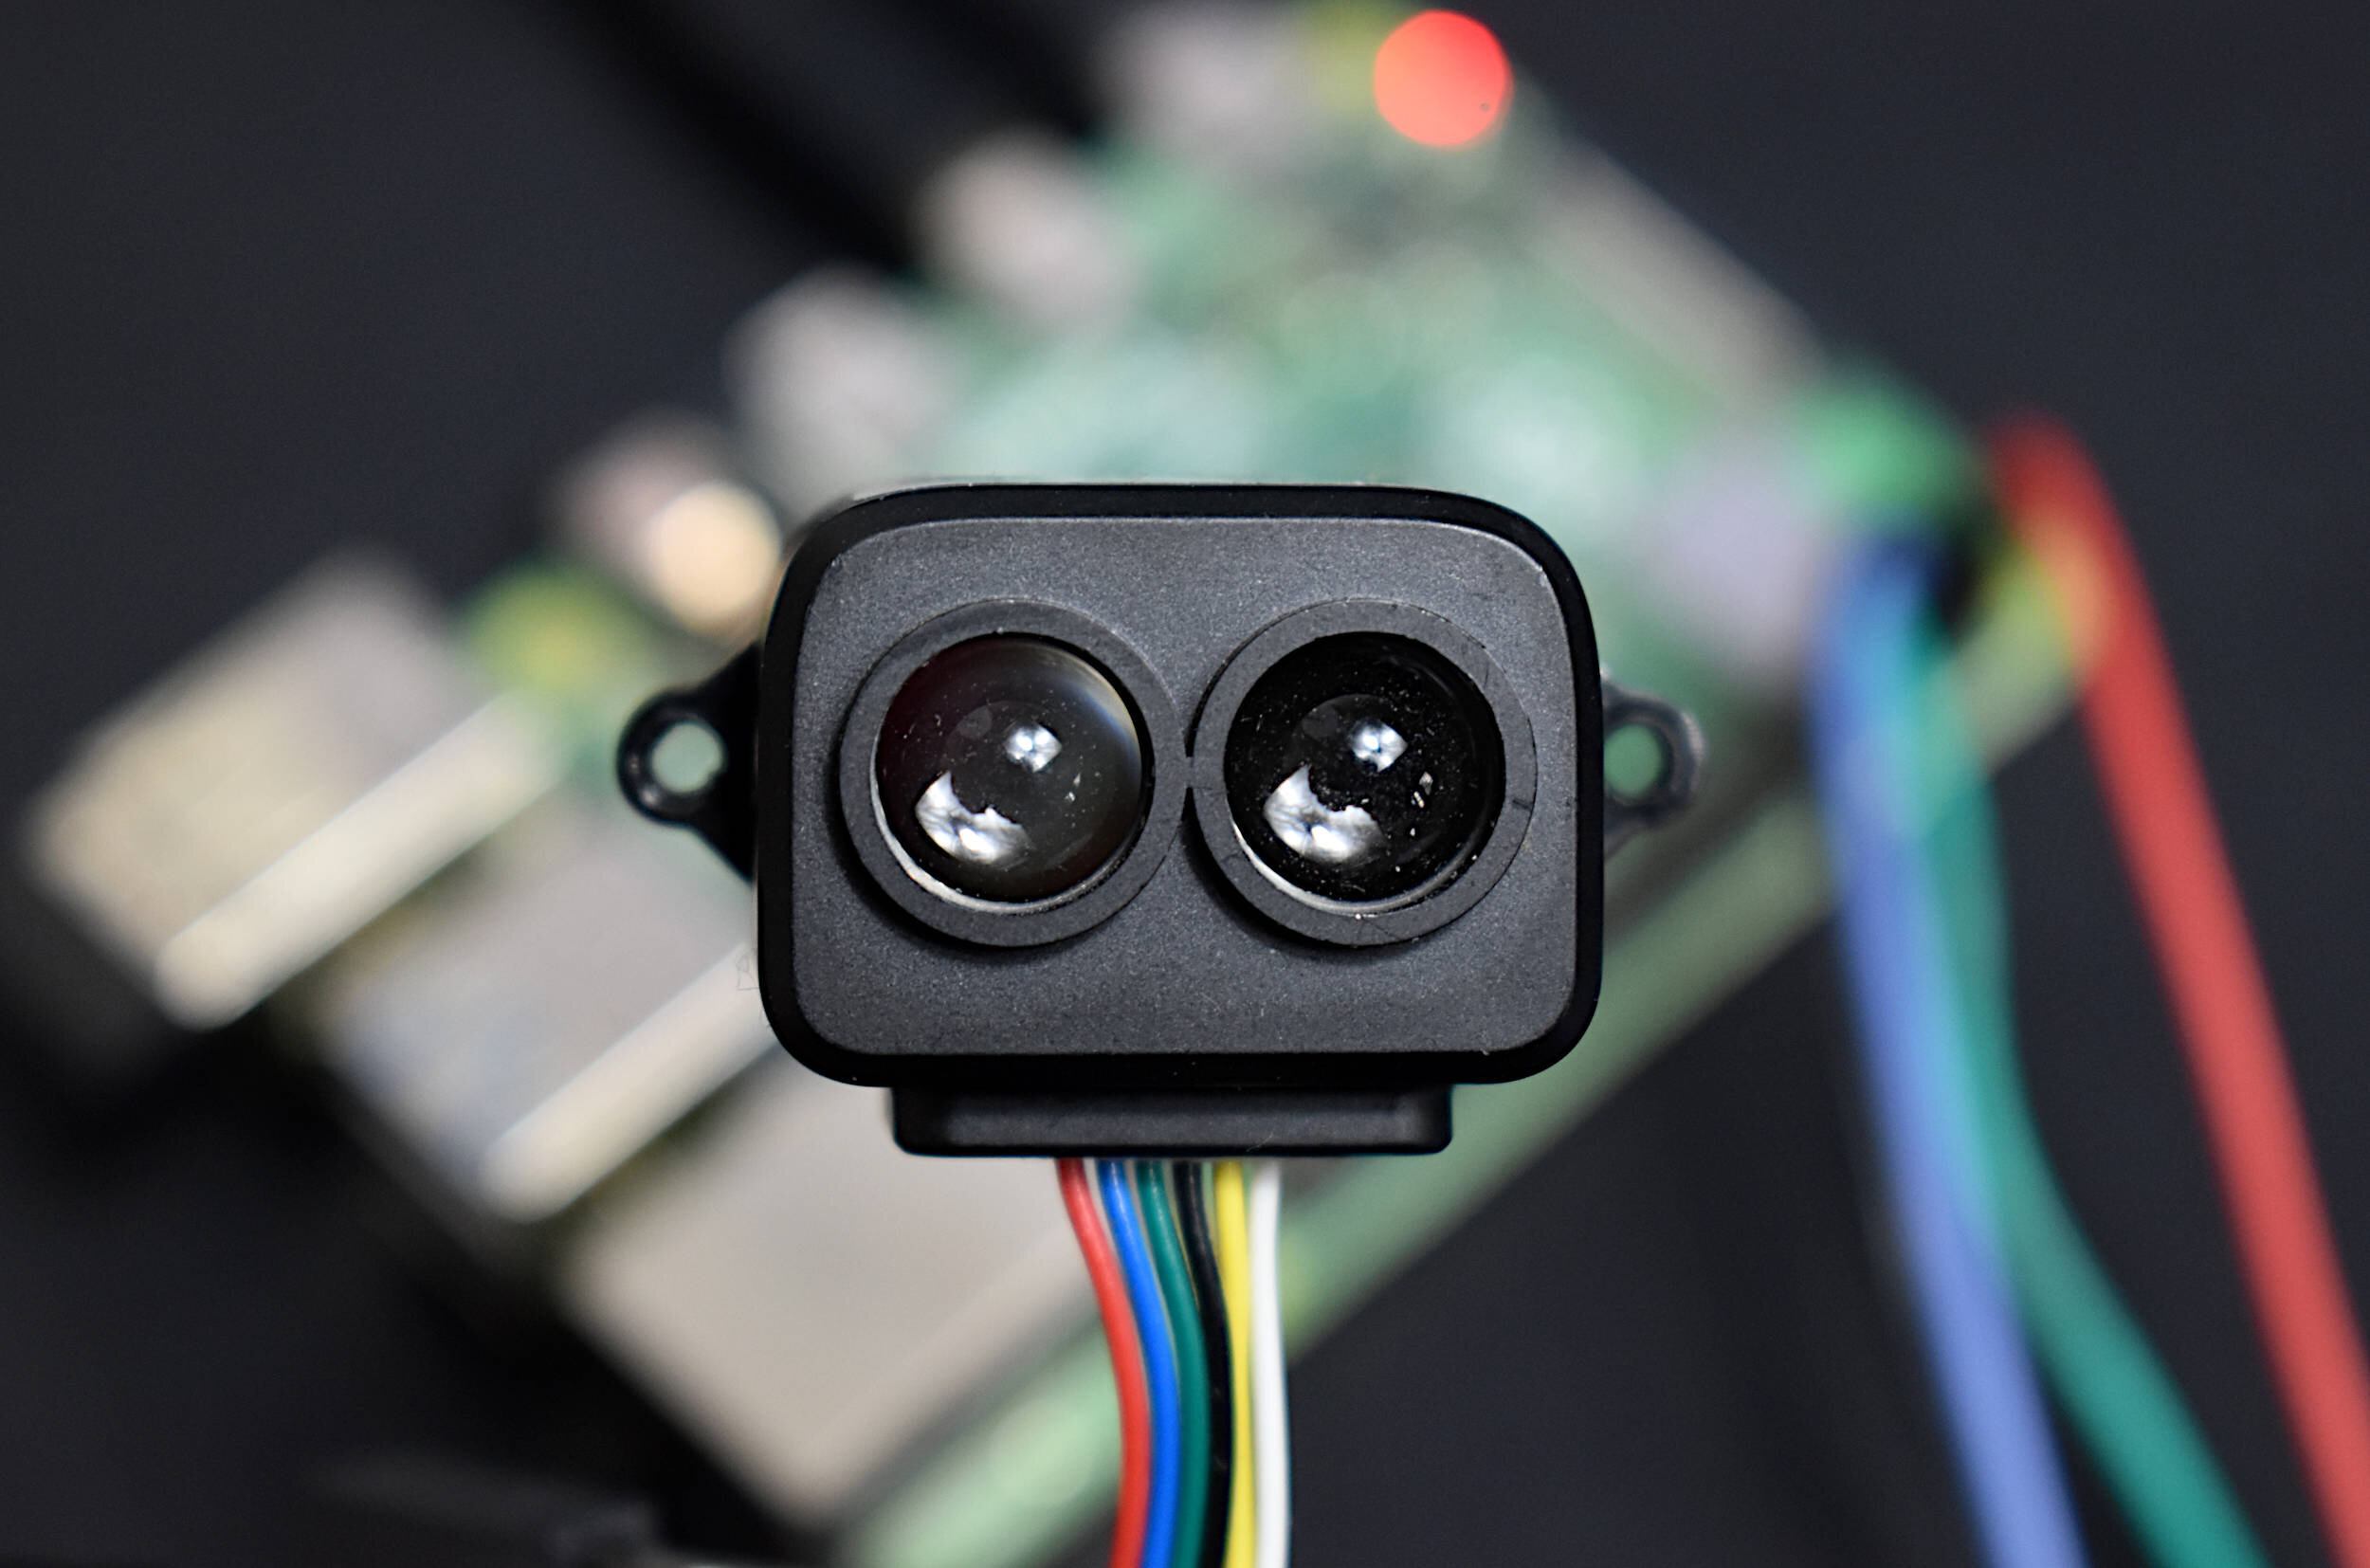
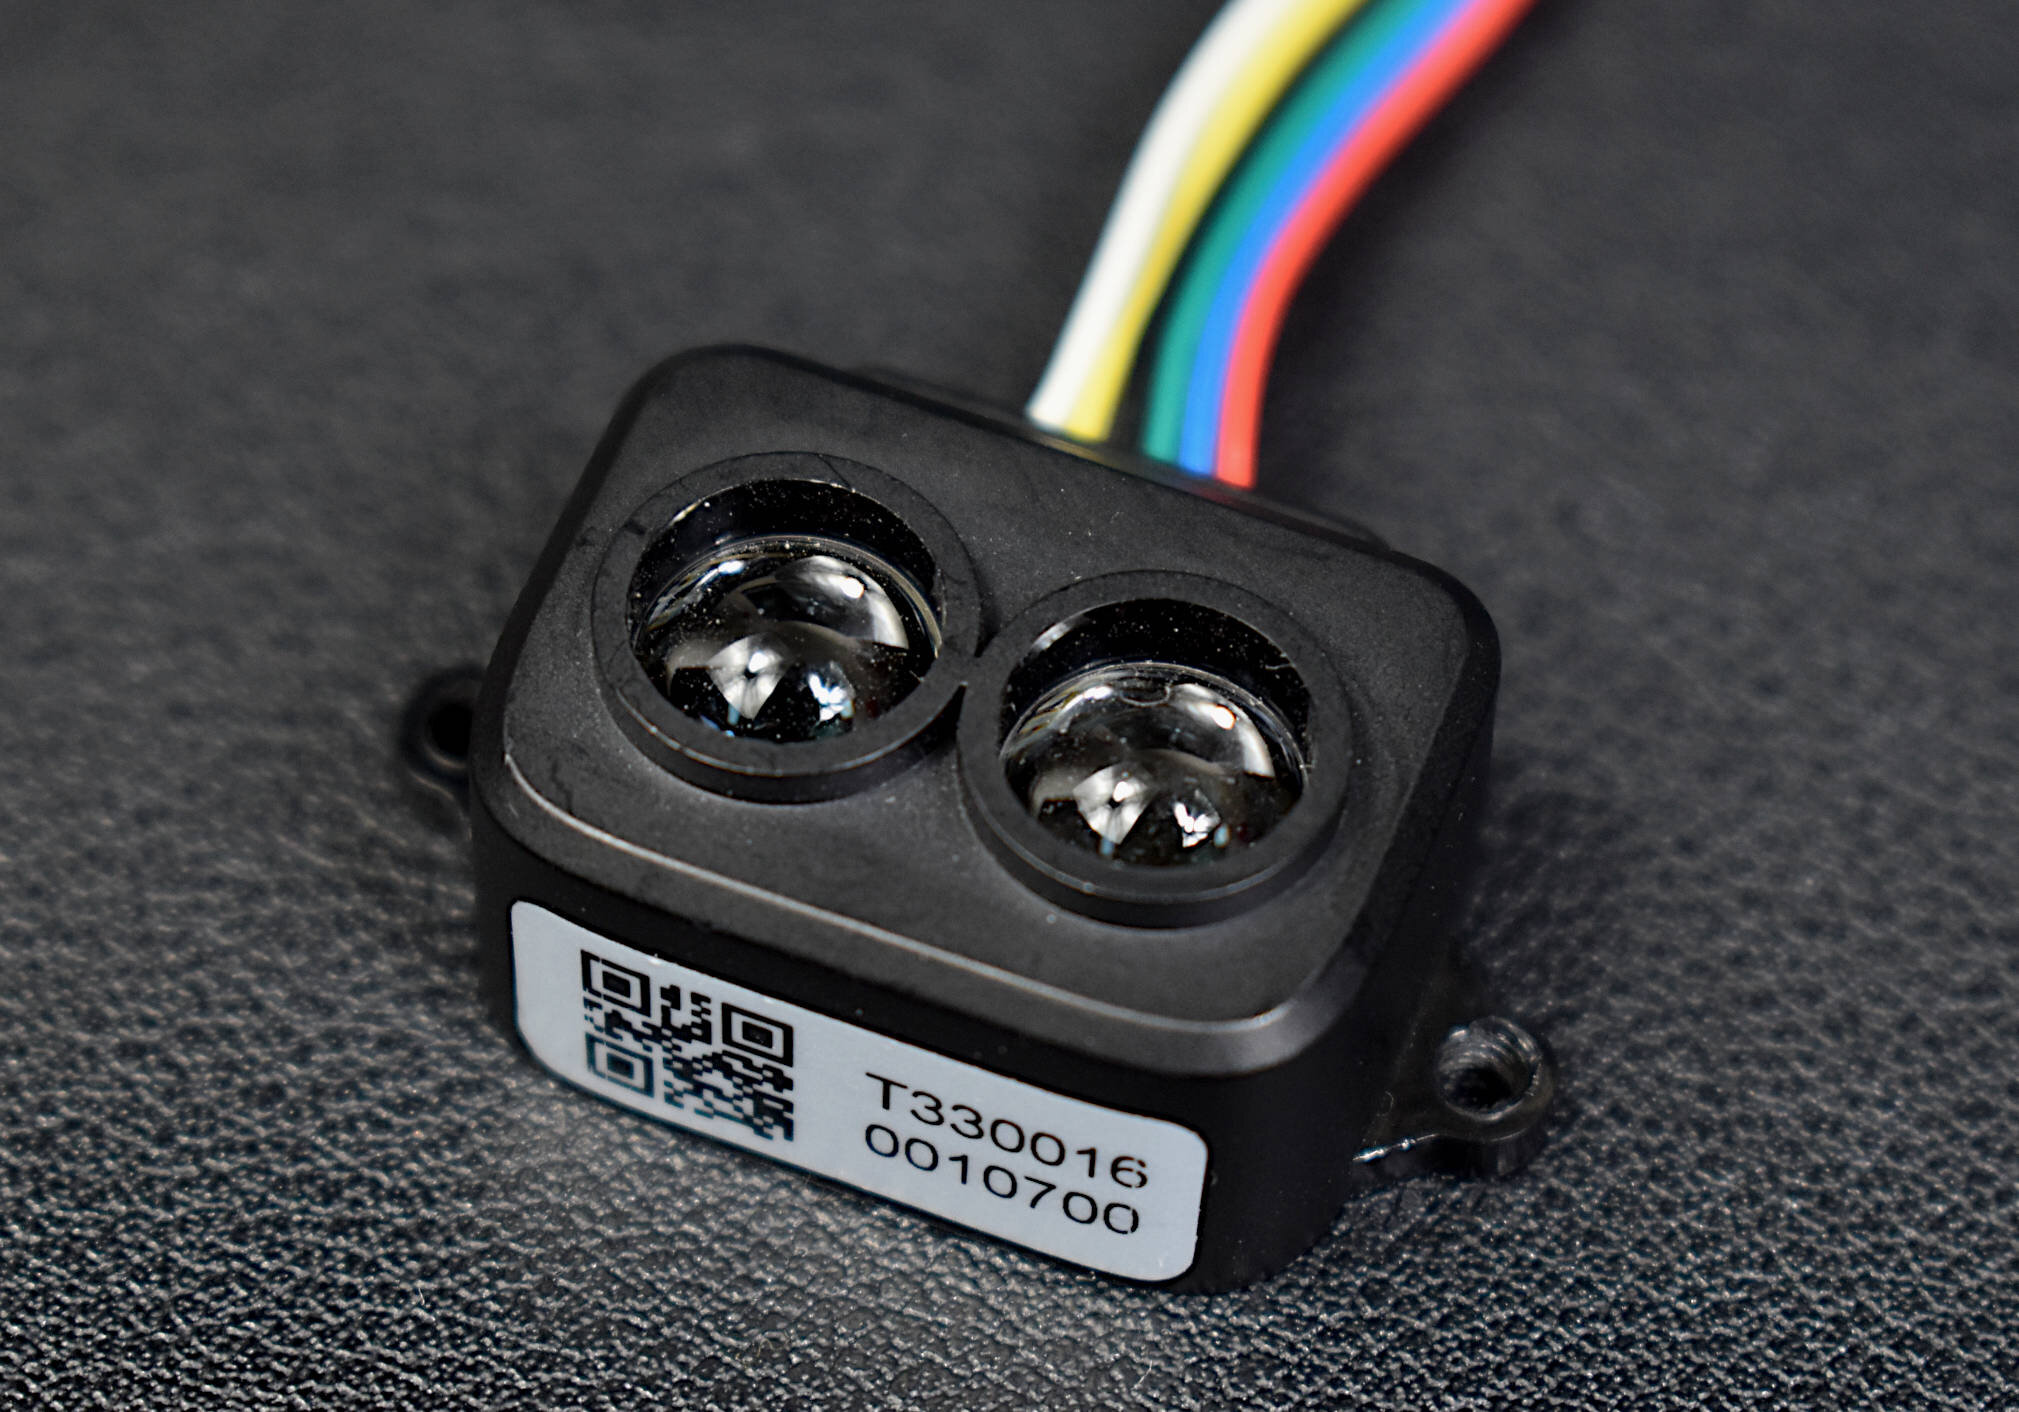
The TF-Luna is an 850nm Light Detection And Ranging (LiDAR) module developed by Benewake that uses the time-of-flight (ToF) principle to detect objects within the field of view of the sensor. The TF-Luna is capable of measuring objects 20cm - 8m away, depending on the ambient light conditions and surface reflectivity of the object(s) being measured. A vertical cavity surface emitting laser (VCSEL) is at the center of the TF-Luna, which is categorized as a Class 1 laser, making it very safe for nearly all applications [read about laser classification here]. The TF-Luna has a selectable sample rate from 1Hz - 250Hz, making it ideal for more rapid distance detection scenarios. In this tutorial, the TF-Luna is wired to a Raspberry Pi 4 computer via the mini UART serial port and powered using the 5V pin. Python will be used to configure and test the LiDAR module, with specific examples and use cases. LiDAR modules have been used in automotive driving systems, drone and quadcopter navigation, 2D-3D object scanning, and other applications in long-range and rapid distance detection.
The only parts used in this tutorial are the TF-Luna LiDAR module and a Raspberry Pi 4 computer. The TF-Luna can be wired directly to the RPi with the jumpers extending from the header of the module, and thus, jumper wires are not needed. We are using a longer set of wires that allow for free-range testing of the module without cable limitations. It is also a good idea to have a tape measure or another type of distance measurement tool to validate the measurements from the LiDAR module. The full parts list for the project is given below:

For the simplest usage, only pins 1-4 are required, which account for VCC, GND, and UART pins (RXD/TXD). The other two pins can be explored in the datasheet for the TF-Luna, for advanced users interested in interrupts, I2C communication, and data readiness flags.

In the next section, the UART Serial port will be enabled on the Raspberry Pi, which is required for communicating with the TF-Luna module.
The TF-Luna communicates with the Raspberry Pi via the Universal Asynchronous Receiver-Transmitter (UART) serial port. The port that we will be using is the mini UART, which correlates to GPIO pins 14/15 (physical pins 8/10). First, the port needs to be enabled via the boot configuration file on the RPi. Screenshots of the step-by-step procedure to do this are given below:

Open the Terminal on the Raspberry Pi and Access the Boot Configuration
Input ‘sudo nano /boot/config.txt’

Scroll to the Bottom of the Boot File and Add ‘enable_uart=1’
Enables mini UART on GPIO 14/15

Reboot the RPi to Accept UART Port Changes

Verify Enabled mini UART with /dev/serial0 -> ttyS0
Enter ‘ls -l /dev/serial*’ and look for /dev/serial0 -> ttyS0'
Assuming the ‘ttyS0’ port (serial0) is showing up on the serial output shown above, we can run a test to verify that the TF-Luna is wired correctly to the Raspberry Pi. A note on the mini UART port: issues can arise specifically when using ‘/dev/ttyS0’ as a Bluetooth port. This is a particular case and may be rare for most users, however, when the issue arises it may be beneficial for the user to explore the extra UART ports on the Raspberry Pi 4. The RPi4 has 4 extra UART ports, which can be accessed using the boot configuration file (read about the specifics here). In short, in place of ‘enable_uart=1’ - the dtoverlay for a specific additional UART port can be enabled. For example, ‘dtoverlay=uart5’ enables UART port 5, which correlates to GPIO pins 14/15 on the RPi4. The specifics of the additional UART ports on the RPi4 can be found in the /boot/overlays/README file on every RPi4. The resulting port will change to /dev/ttyAMA1 or something similar, depending on the port being enabled. Going forward in this tutorial, the mini UART (default ‘enable_uart=1’) will be used on GPIO pins 14/15 (as wired above).
The TF-Luna can be tested by running several simple serial reader programs in Python. The product manual for the TF-Luna is a great resource for learning which commands configure sample rate, baud rate, and data output; and which commands read device info, ranging, chip temperature, and amplitude data. The codes developed here are based on the serial commands introduced in the product manual. All codes cited here can be found on this project’s GitHub page:
The simplest test we can do with the TF-Luna is to print out a test range, chip temperature, and signal amplitude at the module’s default baud rate (115200) and default sample rate (100Hz):
######################################################
# Copyright (c) 2021 Maker Portal LLC
# Author: Joshua Hrisko
######################################################
#
# TF-Luna Mini LiDAR wired to a Raspberry Pi via UART
# --- testing the distance measurement from the TF-Luna
#
#
######################################################
#
import serial,time
import numpy as np
#
##########################
# TFLuna Lidar
##########################
#
ser = serial.Serial("/dev/serial0", 115200,timeout=0) # mini UART serial device
#
############################
# read ToF data from TF-Luna
############################
#
def read_tfluna_data():
    while True:
        counter = ser.in_waiting # count the number of bytes of the serial port
        if counter > 8:
            bytes_serial = ser.read(9) # read 9 bytes
            ser.reset_input_buffer() # reset buffer

            if bytes_serial[0] == 0x59 and bytes_serial[1] == 0x59: # check first two bytes
                distance = bytes_serial[2] + bytes_serial[3]*256 # distance in next two bytes
                strength = bytes_serial[4] + bytes_serial[5]*256 # signal strength in next two bytes
                temperature = bytes_serial[6] + bytes_serial[7]*256 # temp in next two bytes
                temperature = (temperature/8.0) - 256.0 # temp scaling and offset
                return distance/100.0,strength,temperature

if ser.isOpen() == False:
    ser.open() # open serial port if not open

distance,strength,temperature = read_tfluna_data() # read values
print('Distance: {0:2.2f} m, Strength: {1:2.0f} / 65535 (16-bit), Chip Temperature: {2:2.1f} C'.\
              format(distance,strength,temperature)) # print sample data
ser.close() # close serial port
In the above script, the serial port is being accessed for serial0 at a baudrate of 115200. The serial port is first opened before reading or writing any commands [ser.Open()]. Then in the test script, 9-bytes are read and the first two bytes are checked for the correct data format (0x59 and 0x59 are cited as the data return in the product manual). Finally, the data is printed out as distance, signal strength, and chip temperature. This is the simplest test of the TF-Luna that will verify the functionality of the TF-Luna and its wiring to the Raspberry Pi computer. If an error arises - the wiring should be checked first.
Configuring the TF-Luna
The baudrate and sample rate can be changed on the TF-Luna using the configuration code below. The configuration also prints out the firmware version information for each specific TF-Luna module. The sample rate is also checked at the end of the script, in order to print out the approximate sample rate (whether it was changed or not). The sample rate can be tested from 1Hz - 250Hz using the script below.
The baudrate change is a bit more complicated. First, the old baudrate must be used to open the serial port and send a baudrate change command to the TF-Luna module. Next, the first serial port is closed and a second serial port must be opened at the new baudrate in order to communicate with the TF-Luna. This is also shown below:
######################################################
# Copyright (c) 2021 Maker Portal LLC
# Author: Joshua Hrisko
######################################################
#
# TF-Luna Mini LiDAR wired to a Raspberry Pi via UART
# --- Configuring the TF-Luna's baudrate, sample rate,
# --- and printing out the device version info
#
#
######################################################
#
import serial,time
import numpy as np
#
############################
# Serial Functions
############################
#
def read_tfluna_data():
    while True:
        counter = ser.in_waiting # count the number of bytes of the serial port
        bytes_to_read = 9
        if counter > bytes_to_read-1:
            bytes_serial = ser.read(bytes_to_read) # read 9 bytes
            ser.reset_input_buffer() # reset buffer

            if bytes_serial[0] == 0x59 and bytes_serial[1] == 0x59: # check first two bytes
                distance = bytes_serial[2] + bytes_serial[3]*256 # distance in next two bytes
                strength = bytes_serial[4] + bytes_serial[5]*256 # signal strength in next two bytes
                temperature = bytes_serial[6] + bytes_serial[7]*256 # temp in next two bytes
                temperature = (temperature/8) - 256 # temp scaling and offset
                return distance/100.0,strength,temperature

def set_samp_rate(samp_rate=100):
    ##########################
    # change the sample rate
    samp_rate_packet = [0x5a,0x06,0x03,samp_rate,00,00] # sample rate byte array
    ser.write(samp_rate_packet) # send sample rate instruction
    time.sleep(0.1) # wait for change to take effect
    return

def get_version():
    ##########################
    # get version info
    info_packet = [0x5a,0x04,0x14,0x00]

    ser.write(info_packet)
    time.sleep(0.1)
    bytes_to_read = 30
    t0 = time.time()
    while (time.time()-t0)<5:
        counter = ser.in_waiting
        if counter > bytes_to_read:
            bytes_data = ser.read(bytes_to_read)
            ser.reset_input_buffer()
            if bytes_data[0] == 0x5a:
                version = bytes_data[3:-1].decode('utf-8')
                print('Version -'+version)
                return
            else:
                ser.write(info_packet)
                time.sleep(0.1)

def set_baudrate(baud_indx=4):
    ##########################
    # get version info
    baud_hex = [[0x80,0x25,0x00], # 9600
                [0x00,0x4b,0x00], # 19200
                [0x00,0x96,0x00], # 38400
                [0x00,0xe1,0x00], # 57600
                [0x00,0xc2,0x01], # 115200
                [0x00,0x84,0x03], # 230400
                [0x00,0x08,0x07], # 460800
                [0x00,0x10,0x0e]]  # 921600
    info_packet = [0x5a,0x08,0x06,baud_hex[baud_indx][0],baud_hex[baud_indx][1],
                   baud_hex[baud_indx][2],0x00,0x00] # instruction packet

    prev_ser.write(info_packet) # change the baud rate
    time.sleep(0.1) # wait to settle
    prev_ser.close() # close old serial port
    time.sleep(0.1) # wait to settle
    ser_new =serial.Serial("/dev/serial0", baudrates[baud_indx],timeout=0) # new serial device
    if ser_new.isOpen() == False:
        ser_new.open() # open serial port if not open
    bytes_to_read = 8
    t0 = time.time()
    while (time.time()-t0)<5:
        counter = ser_new.in_waiting
        if counter > bytes_to_read:
            bytes_data = ser_new.read(bytes_to_read)
            ser_new.reset_input_buffer()
            if bytes_data[0] == 0x5a:
                indx = [ii for ii in range(0,len(baud_hex)) if \
                        baud_hex[ii][0]==bytes_data[3] and
                        baud_hex[ii][1]==bytes_data[4] and
                        baud_hex[ii][2]==bytes_data[5]]
                print('Baud Rate = {0:1d}'.format(baudrates[indx[0]]))
                time.sleep(0.1)
                return ser_new
            else:
                ser_new.write(info_packet) # try again if wrong data received
                time.sleep(0.1) # wait 100ms
                continue

#
############################
# Configurations
############################
#
baudrates = [9600,19200,38400,57600,115200,230400,460800,921600] # baud rates
prev_indx = 4 # previous baud rate index (current TF-Luna baudrate)
prev_ser = serial.Serial("/dev/serial0", baudrates[prev_indx],timeout=0) # mini UART serial device
if prev_ser.isOpen() == False:
    prev_ser.open() # open serial port if not open
baud_indx = 4 # baud rate to be changed to (new baudrate for TF-Luna)
ser = set_baudrate(baud_indx) # set baudrate, get new serial at new baudrate
set_samp_rate(100) # set sample rate 1-250
get_version() # print version info for TF-Luna
time.sleep(0.1) # wait 100ms to settle

#
############################
# Testing the TF-Luna Output
############################
#
tot_pts = 100 # points for sample rate test
t0 = time.time() # for timing
dist_array = [] # for storing values
while len(dist_array)<tot_pts:
    try:
        distance,strength,temperature = read_tfluna_data() # read values
        dist_array.append(distance) # append to array
    except:
        continue
print('Sample Rate: {0:2.0f} Hz'.format(len(dist_array)/(time.time()-t0))) # print sample rate
ser.close() # close serial port
Below is an example output from the Raspberry Pi Python configuration code ran for the TF-Luna:
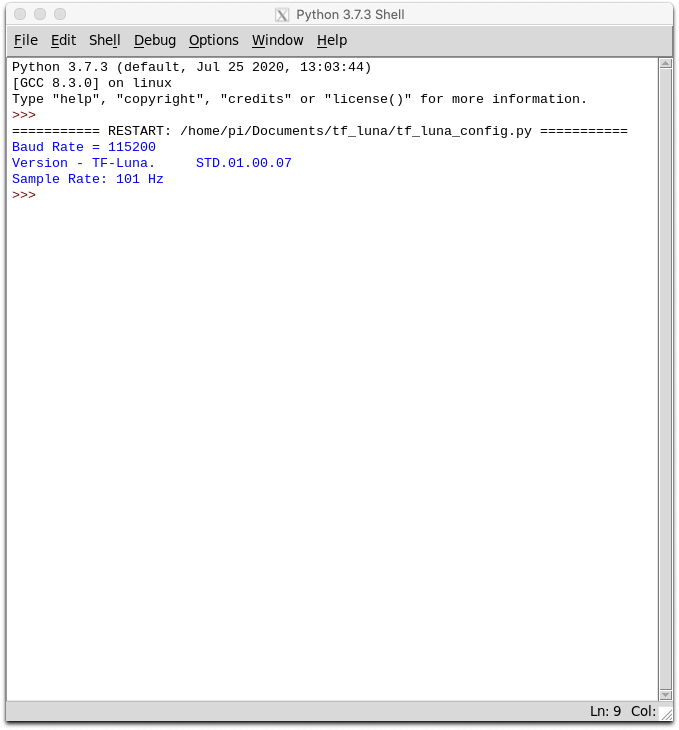
Example Output After Configuration
Baudrate = 115200, Sample Rate = 100Hz, Name = TF-Luna, Firmware Version = 1.0.7
Plotting TF-Luna Distance Ranging
Below is an addition to the configuration code above that plots the test ranging samples acquired to approximate the sample rate of the TF-Luna. The code sets the sample rate to 100Hz, baudrate to 115200, and acquires 100 samples to plot. The code then plots the 100 samples of a test range. The code is given below, followed by an example output plot:
######################################################
# Copyright (c) 2021 Maker Portal LLC
# Author: Joshua Hrisko
######################################################
#
# TF-Luna Mini LiDAR wired to a Raspberry Pi via UART
# --- test ranging plotter for TF-Luna
#
#
######################################################
#
import serial,time
import numpy as np
import matplotlib.pyplot as plt
#
############################
# Serial Functions
############################
#
def read_tfluna_data():
    while True:
        counter = ser.in_waiting # count the number of bytes of the serial port
        bytes_to_read = 9
        if counter > bytes_to_read-1:
            bytes_serial = ser.read(bytes_to_read) # read 9 bytes
            ser.reset_input_buffer() # reset buffer

            if bytes_serial[0] == 0x59 and bytes_serial[1] == 0x59: # check first two bytes
                distance = bytes_serial[2] + bytes_serial[3]*256 # distance in next two bytes
                strength = bytes_serial[4] + bytes_serial[5]*256 # signal strength in next two bytes
                temperature = bytes_serial[6] + bytes_serial[7]*256 # temp in next two bytes
                temperature = (temperature/8) - 256 # temp scaling and offset
                return distance/100.0,strength,temperature

def set_samp_rate(samp_rate=100):
    ##########################
    # change the sample rate
    samp_rate_packet = [0x5a,0x06,0x03,samp_rate,00,00] # sample rate byte array
    ser.write(samp_rate_packet) # send sample rate instruction
    return

def get_version():
    ##########################
    # get version info
    info_packet = [0x5a,0x04,0x14,0x00]

    ser.write(info_packet)
    time.sleep(0.1)
    bytes_to_read = 30
    t0 = time.time()
    while (time.time()-t0)<5:
        counter = ser.in_waiting
        if counter > bytes_to_read:
            bytes_data = ser.read(bytes_to_read)
            ser.reset_input_buffer()
            if bytes_data[0] == 0x5a:
                version = bytes_data[3:-1].decode('utf-8')
                print('Version -'+version)
                return
            else:
                ser.write(info_packet)
                time.sleep(0.1)

def set_baudrate(baud_indx=4):
    ##########################
    # get version info
    baud_hex = [[0x80,0x25,0x00], # 9600
                [0x00,0x4b,0x00], # 19200
                [0x00,0x96,0x00], # 38400
                [0x00,0xe1,0x00], # 57600
                [0x00,0xc2,0x01], # 115200
                [0x00,0x84,0x03], # 230400
                [0x00,0x08,0x07], # 460800
                [0x00,0x10,0x0e]]  # 921600
    info_packet = [0x5a,0x08,0x06,baud_hex[baud_indx][0],baud_hex[baud_indx][1],
                   baud_hex[baud_indx][2],0x00,0x00] # instruction packet

    prev_ser.write(info_packet) # change the baud rate
    time.sleep(0.1) # wait to settle
    prev_ser.close() # close old serial port
    time.sleep(0.1) # wait to settle
    ser_new =serial.Serial("/dev/serial0", baudrates[baud_indx],timeout=0) # new serial device
    if ser_new.isOpen() == False:
        ser_new.open() # open serial port if not open
    bytes_to_read = 8
    t0 = time.time()
    while (time.time()-t0)<5:
        counter = ser_new.in_waiting
        if counter > bytes_to_read:
            bytes_data = ser_new.read(bytes_to_read)
            ser_new.reset_input_buffer()
            if bytes_data[0] == 0x5a:
                indx = [ii for ii in range(0,len(baud_hex)) if \
                        baud_hex[ii][0]==bytes_data[3] and
                        baud_hex[ii][1]==bytes_data[4] and
                        baud_hex[ii][2]==bytes_data[5]]
                print('Set Baud Rate = {0:1d}'.format(baudrates[indx[0]]))
                time.sleep(0.1)
                return ser_new
            else:
                ser_new.write(info_packet) # try again if wrong data received
                time.sleep(0.1) # wait 100ms
                continue

#
############################
# Configurations
############################
#
baudrates = [9600,19200,38400,57600,115200,230400,460800,921600] # baud rates
prev_indx = 4 # previous baud rate index (current TF-Luna baudrate)
prev_ser = serial.Serial("/dev/serial0", baudrates[prev_indx],timeout=0) # mini UART serial device
if prev_ser.isOpen() == False:
    prev_ser.open() # open serial port if not open
baud_indx = 4 # baud rate to be changed to (new baudrate for TF-Luna)
ser = set_baudrate(baud_indx) # set baudrate, get new serial at new baudrate
set_samp_rate(100) # set sample rate 1-250
get_version() # print version info for TF-Luna

#
############################
# Testing the TF-Luna Output
############################
#
tot_pts = 100 # points for sample rate test
time_array,dist_array = [],[] # for storing values
print('Starting Ranging...')
while len(dist_array)<tot_pts:
    try:
        distance,strength,temperature = read_tfluna_data() # read values
        dist_array.append(distance) # append to array
        time_array.append(time.time())
    except:
        continue
print('Sample Rate: {0:2.0f} Hz'.format(len(dist_array)/(time_array[-1]-time_array[0]))) # print sample rate
ser.close() # close serial port
#
##############################
# Plotting the TF-Luna Output
##############################
#
plt.style.use('ggplot') # figure formatting
fig,ax = plt.subplots(figsize=(12,9)) # figure and axis
ax.plot(np.subtract(time_array,time_array[0]),dist_array,linewidth=3.5) # plot ranging data
ax.set_ylabel('Distance [m]',fontsize=16)
ax.set_xlabel('Time [s]',fontsize=16)
ax.set_title('TF-Luna Ranging Test',fontsize=18)
plt.show() # show figure

The plot above is the result of a hand being placed near the TF-Luna module and quickly moving it away. A real-time plotter will be explored in the next section, where the timing behavior of the TF-Luna will be studied.
The behavior of the TF-Luna can be tested by visualizing the ranging and signal strength data in near real-time using matplotlib in Python. A visualization and handling of the real-time incoming data is given in the code below (and on GitHub):
######################################################
# Copyright (c) 2021 Maker Portal LLC
# Author: Joshua Hrisko
######################################################
#
# TF-Luna Mini LiDAR wired to a Raspberry Pi via UART
# --- Real-time ranging with signal strength indicator
#
#
######################################################
#
import serial,time
import numpy as np
import matplotlib.pyplot as plt
#
############################
# Serial Functions
############################
#
def read_tfluna_data():
    while True:
        counter = ser.in_waiting # count the number of bytes waiting to be read
        bytes_to_read = 9
        if counter > bytes_to_read-1:
            bytes_serial = ser.read(bytes_to_read) # read 9 bytes
            ser.reset_input_buffer() # reset buffer

            if bytes_serial[0] == 0x59 and bytes_serial[1] == 0x59: # check first two bytes
                distance = bytes_serial[2] + bytes_serial[3]*256 # distance in next two bytes
                strength = bytes_serial[4] + bytes_serial[5]*256 # signal strength in next two bytes
                temperature = bytes_serial[6] + bytes_serial[7]*256 # temp in next two bytes
                temperature = (temperature/8) - 256 # temp scaling and offset
                return distance/100.0,strength,temperature

def set_samp_rate(samp_rate=100):
    ##########################
    # change the sample rate
    samp_rate_packet = [0x5a,0x06,0x03,samp_rate,00,00] # sample rate byte array
    ser.write(samp_rate_packet) # send sample rate instruction
    return

def get_version():
    ##########################
    # get version info
    info_packet = [0x5a,0x04,0x14,0x00]

    ser.write(info_packet) # write packet
    time.sleep(0.1) # wait to read
    bytes_to_read = 30 # prescribed in the product manual
    t0 = time.time()
    while (time.time()-t0)<5:
        counter = ser.in_waiting
        if counter > bytes_to_read:
            bytes_data = ser.read(bytes_to_read)
            ser.reset_input_buffer()
            if bytes_data[0] == 0x5a:
                version = bytes_data[3:-1].decode('utf-8')
                print('Version -'+version) # print version details
                return
            else:
                ser.write(info_packet) # if fails, re-write packet
                time.sleep(0.1) # wait

def set_baudrate(baud_indx=4):
    ##########################
    # get version info
    baud_hex = [[0x80,0x25,0x00], # 9600
                [0x00,0x4b,0x00], # 19200
                [0x00,0x96,0x00], # 38400
                [0x00,0xe1,0x00], # 57600
                [0x00,0xc2,0x01], # 115200
                [0x00,0x84,0x03], # 230400
                [0x00,0x08,0x07], # 460800
                [0x00,0x10,0x0e]]  # 921600
    info_packet = [0x5a,0x08,0x06,baud_hex[baud_indx][0],baud_hex[baud_indx][1],
                   baud_hex[baud_indx][2],0x00,0x00] # instruction packet

    prev_ser.write(info_packet) # change the baud rate
    time.sleep(0.1) # wait to settle
    prev_ser.close() # close old serial port
    time.sleep(0.1) # wait to settle
    ser_new =serial.Serial("/dev/serial0", baudrates[baud_indx],timeout=0) # new serial device
    if ser_new.isOpen() == False:
        ser_new.open() # open serial port if not open
    bytes_to_read = 8
    t0 = time.time()
    while (time.time()-t0)<5:
        counter = ser_new.in_waiting
        if counter > bytes_to_read:
            bytes_data = ser_new.read(bytes_to_read)
            ser_new.reset_input_buffer()
            if bytes_data[0] == 0x5a:
                indx = [ii for ii in range(0,len(baud_hex)) if \
                        baud_hex[ii][0]==bytes_data[3] and
                        baud_hex[ii][1]==bytes_data[4] and
                        baud_hex[ii][2]==bytes_data[5]]
                print('Set Baud Rate = {0:1d}'.format(baudrates[indx[0]]))
                time.sleep(0.1)
                return ser_new
            else:
                ser_new.write(info_packet) # try again if wrong data received
                time.sleep(0.1) # wait 100ms
                continue

#
############################
# Configurations
############################
#
baudrates = [9600,19200,38400,57600,115200,230400,460800,921600] # baud rates
prev_indx = 4 # previous baud rate index (current TF-Luna baudrate)
prev_ser = serial.Serial("/dev/serial0", baudrates[prev_indx],timeout=0) # mini UART serial device
if prev_ser.isOpen() == False:
    prev_ser.open() # open serial port if not open
baud_indx = 4 # baud rate to be changed to (new baudrate for TF-Luna)
ser = set_baudrate(baud_indx) # set baudrate, get new serial at new baudrate
set_samp_rate(100) # set sample rate 1-250
get_version() # print version info for TF-Luna
#
##############################################
# Plotting functions
##############################################
#
def plotter():
    ################################################
    # ---- start real-time ranging and strength bar
    ################################################
    #
    plt.style.use('ggplot') # plot formatting
    fig,axs = plt.subplots(1,2,figsize=(12,8),
                        gridspec_kw={'width_ratios': [5,1]}) # create figure
    fig.canvas.set_window_title('TF-Luna Real-Time Ranging')
    fig.subplots_adjust(wspace=0.05)
    # ranging axis formatting
    axs[0].set_xlabel('Sample',fontsize=16)
    axs[0].set_ylabel('Amplitude',fontsize=16) # amplitude label
    axs[0].set_xlim([0.0,plot_pts])
    axs[0].set_ylim([0.0,8.0]) # set ranging limits
    # signal strength axis formatting
    axs[1].set_xlim([-1.0,1.0]) # strength bar width
    axs[1].set_xticks([]) # remove x-ticks
    axs[1].set_ylim([1.0,2**16]) # set signal strength limits
    axs[1].yaxis.tick_right() # move strength ticks to right
    axs[1].yaxis.set_label_position('right') # label to right
    axs[1].set_ylabel('Signal Strength',fontsize=16,labelpad=6.0)
    axs[1].set_yscale('log') # log scale for better visual
    # draw and background specification
    fig.canvas.draw() # draw initial plot
    ax1_bgnd = fig.canvas.copy_from_bbox(axs[0].bbox) # get background
    ax2_bgnd = fig.canvas.copy_from_bbox(axs[1].bbox) # get background
    line1, = axs[0].plot(np.zeros((plot_pts,)),linewidth=3.0,
                color=plt.cm.Set1(1)) # dummy initial ranging data (zeros)
    bar1,  = axs[1].bar(0.0,1.0,width=1.0,color=plt.cm.Set1(2))
    fig.show() # show plot
    return fig,axs,ax1_bgnd,ax2_bgnd,line1,bar1

def plot_updater():
    ##########################################
    # ---- time series
    fig.canvas.restore_region(ax1_bgnd) # restore background 1 (for speed)
    fig.canvas.restore_region(ax2_bgnd) # restore background 2
    line1.set_ydata(dist_array) # update channel data
    bar1.set_height(strength) # update signal strength
    if strength<100.0 or strength>30000.0:
        bar1.set_color(plt.cm.Set1(0)) # if invalid strength, make bar red
    else:
        bar1.set_color(plt.cm.Set1(2)) # green bar
    axs[0].draw_artist(line1) # draw line
    axs[1].draw_artist(bar1) # draw signal strength bar
    fig.canvas.blit(axs[0].bbox) # blitting (for speed)
    fig.canvas.blit(axs[1].bbox) # blitting
    fig.canvas.flush_events() # required for blitting
    return line1,bar1
#
############################
# Real-Time Plotter Loop
############################
#
plot_pts = 100 # points for sample rate test
fig,axs,ax1_bgnd,ax2_bgnd,line1,bar1 = plotter() # instantiate figure and plot
dist_array = [] # for updating values
print('Starting Ranging...')
while True:
    distance,strength,temperature = read_tfluna_data() # read values
    dist_array.append(distance) # append to array
    if len(dist_array)>plot_pts:
        dist_array = dist_array[1:] # drop first point (maintain array size)
        line1,bar1 = plot_updater() # update plot
ser.close() # close serial port
The code uses blitting to speed up the visualization update. The distance detection is plotted on a time-series graph, while the signal strength is given in the form of a bar chart. This allows the user to see if a given object or scan routine is outputting poor signal strength. An example output of the real-time graph is given below:
Real-Time Ranging Output from the TF-Luna

A video demonstration of the real-time ranging is also given below:
The TF-Luna Light Detection and Ranging (LiDAR) module was introduced as a rapid distance detection time-of-flight sensor compatible with the Raspberry Pi computer. The module was wired to the RPi via the UART serial port on GPIO pins 14/15. The sensor was shown to update at a maximum rate of 250 detections per second (250Hz sample rate). The configuration of the LiDAR module was given for the sample rate and baudrate. Commands to read firmware version information and the general ranging data packet were also given. The data packet received from the TF-Luna outputs ranging distance, signal amplitude, and chip temperature. A plotter tool was introduced as a way of testing the functionality of the module and visualizing the behavior of the LiDAR. In the next entry of the TF-Luna series, specific characterization of the LiDAR will be explored again on the Raspberry Pi, with tests involving different surface types, distance accuracy, field-of-view (FoV) tests, and other analyses.

See More in Raspberry Pi and Sensors: