MATLAB Datalogger with Arduino

“As an Amazon Associates Program member, clicking on links may result in Maker Portal receiving a small commission that helps support future projects.”
MATLAB is a powerful tool utilized by over 4 million engineers and scientists around the world [MATLAB facts]. It is often the first programming language exposed to students during university and is also a helpful stepping stone for transitioning into data analysis and numerical algorithm development. In this tutorial, I will introduce MATLAB as an interface for data acquisition from an Arduino board. The Arduino, in this particular case, will communicate with a Windows computer via the serial port and send data from an Arduino-compatible sensor, which will subsequently be read by MATLAB through its serial communication library. Serial communication from hardware to MATLAB is very simple and requires only a few lines of code. I will also introduce a real-time analysis and plotting routine to visualize the Arduino data as it arrives in real time. This particular method of data analysis and visualization in real time is incredibly useful for engineers interested in experimentation where microcontrollers and sensors may be used, along with complex data acquisition systems.
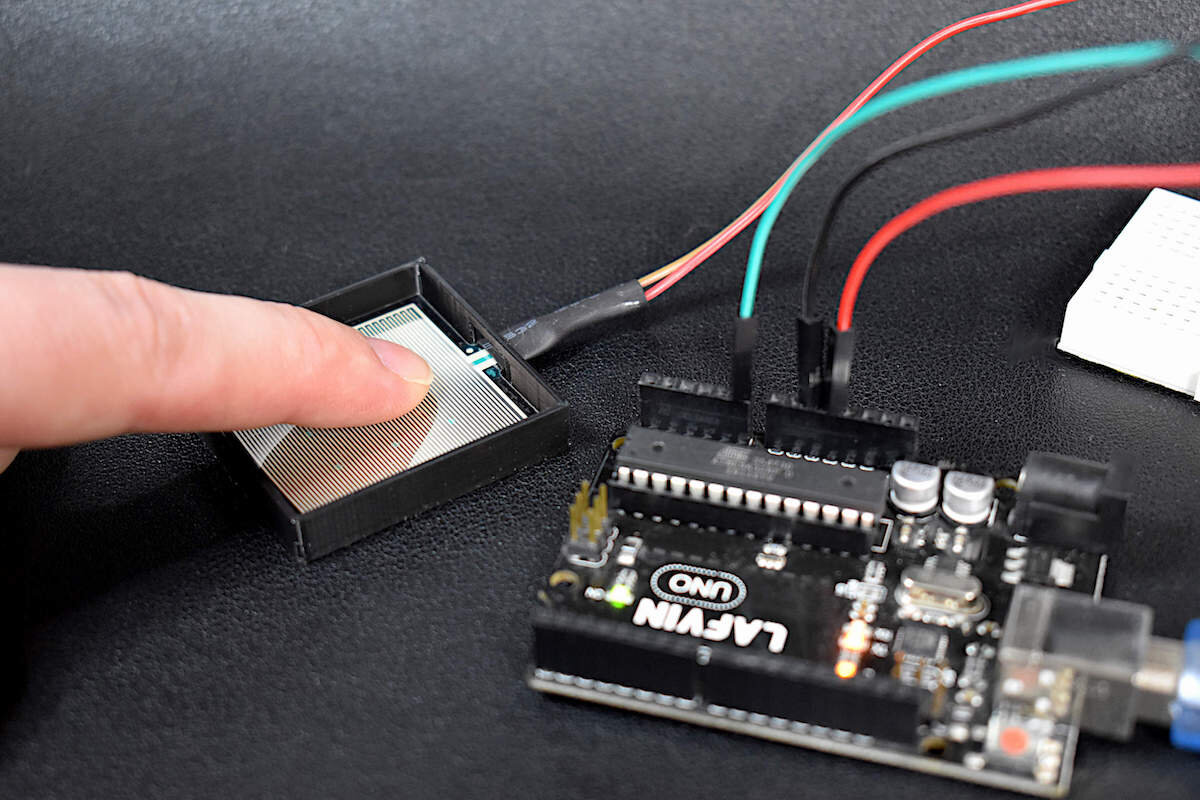
In my particular case, I will be using the AMG8833 infrared thermal camera sensor that is fully compatible with Arduino. I’m using the AMG8833 to test the limits of the serial upload speed and my computer’s ability to update a real-time plot of the 8x8 pixel temperature array data. It is an interesting project that has real-world applications in heat transfer, equipment health monitoring, and even military applications. The parts list used in this experiment is given below:
Arduino Uno Board - $11.00 [Our Shop]
AMG8833 Infrared Thermal Camera Sensor - $60.00 [Our Shop ]
Jumper Wires - $0.15 each [Our Shop]
Mini Breadboard - $3.00 [Our Shop]
Wiring the AMG8833 to an Arduino board is simple - all the AMG8833 needs is power and I2C communication with the following connections:
| AMG8833 Pin | Arduino Uno Pin |
|---|---|
| VIN | 3.3V |
| GND | GND |
| SDA | A4 |
| SCL | A5 |

In the next section, the basics of printing from Arduino and reading from MATLAB will be introduced.
Here, I’m using randomized integers in Arduino that are printed to the serial port. Then, MATLAB reads the random data and plots it in real time. The code for the Arduino portion is shown first, followed by the MATLAB code.
// Arduino Code printing random integers to the serial port
void setup() {
  Serial.begin(115200);
}

void loop() {
  int ii = random(255);
  Serial.println(String(ii));
  delay(50);
}
The general process for reading data from the serial port involves:
Setting the correct serial port
Setting the baud rate
Opening the serial port
Reading from the serial port
This process is shown below:
% MATLAB data for reading Arduino serial prinout data
instrreset % reset all serial ports
s = serial('COM6'); % change this to desired Arduino board port
set(s,'BaudRate',115200); % baud rate for communication
fopen(s); % open the comm between Arduino and MATLAB
out = fscanf(s); % read data
The resulting output variable named ‘out’ contains the printed data plus a carriage return and newline. We can split the output using the MATLAB ‘split(out,‘,’)’ function, which separates the comma-separated values. We can finally convert the values to doubles using the ‘str2double()’ function. This process of reading from the serial port and converting to doubles is shown below:
% MATLAB data for reading Arduino serial prinout data
instrreset % reset all serial ports
s = serial('COM6'); % change this to desired Arduino board port
set(s,'BaudRate',115200); % baud rate for communication
fopen(s); % open the comm between Arduino and MATLAB
out = fscanf(s); % read data
data_str = split(out,',');
n_vars = 1; % number of variables printed
data_array = zeros(n_vars,1);
for ii=1:n_vars
    data_array(ii) = str2double(data_str(ii));
end
Next, if we want to create a loop for iterating through data and plotting in real time, we need to setup a more complex system for plotting. The MATLAB code for reading the Arduino serial data in real time is given below:
% MATLAB data for reading Arduino serial prinout data
instrreset % reset all serial ports
clear all
close all
clc

s = serial('COM6'); % change this to desired Arduino board port
set(s,'BaudRate',115200); % baud rate for communication
fopen(s); % open the comm between Arduino and MATLAB
plot_len = 500; % length of plot that updates
x_vals = linspace(0,plot_len,plot_len); % x-values
plot_var = zeros(plot_len,1); % zeros before data comes in

% figure and axes parameters
f1 = figure();
title('MATLAB Serial Readout From Arduino')
xlabel('Sample')
ylabel('Amplitude')
screen = get(0,'screensize');
fig_span = 0.9; % figure size 90% of screen
set(gcf,'Position',[((1.0-fig_span)/2.0)*screen(3),((1.0-fig_span)/2.0)*screen(4),...
    (fig_span*screen(3))-((1.0-fig_span)/2.0)*screen(3),(fig_span*screen(4))-((1.0-fig_span)/2.0)*screen(3)],...
    'color',[252.0,252.0,252.0]/256.0)
f1.Color = [252.0,252.0,252.0]/256.0;
f1.InvertHardcopy = 'off';
set(gca,'FontSize',20,'Color',[205.0,205.0,205.0]/256.0,'GridColor',[252.0,252.0,252.0]/256.0,...
    'LineWidth',1.5,'GridAlpha',0.5)
grid('on')
hold on
loop_break = true; % dummy variable to exit loop when BREAK is pressed
dialogBox = uicontrol('Style', 'PushButton', 'String', 'Break Loop','Callback', 'loop_break = false;');
% plot zeros so we can just update it later
p1 = plot(x_vals,plot_var,'linewidth',2);

while loop_break
    out = fscanf(s);
    plot_var(1:end-1) = plot_var(2:end);
    plot_var(end) = str2double(out);
    set(p1,'Ydata',plot_var)
    pause(0.05)
end
fclose(s)
delete(s)
% delete(dialogBox) % delete dialog box that stops serial process
% print('matlab_serial_read_random','-dpng','-r300') % uncomment to save
The resulting output plot created by MATLAB is shown below:

The following process should be followed when carrying-out this MATLAB serial port read procedure:
Upload sketch to Arduino that prints out to the serial port
Ensure the correct device comm port is inputted. In Windows, my port serial read port is ‘COM6,’ so the serial read is updated to : “serial('COM6')”
Run MATLAB code
When finished or if there is an error, hit the ‘Break Loop’ button in the bottom left corner of the plot (similar to that shown above)
In the next section, I will read AMG8833 thermal camera data from the Arduino serial printout, and use MATLAB to plot the 64 data points to populate a mesh plot that represents the 8x8 thermal temperature array.
In a similar method as above, we can read the AMG8833 Thermal Array sensor over the serial port by printing all 64 pixels onto the serial port from the Arduino side, then parsing the 64 pixels back on the MATLAB side. The Arduino code is shown below, where the 64 pixels are read and printed to the serial port, then at the end of the 64th pixel, we print a carriage return to notify MATLAB that the AMG8833 printout has finished.
// Arduino code for printing AMG8833 Temperature Data to Serial Port
#include <Wire.h>
#include <SparkFun_GridEYE_Arduino_Library.h>

GridEYE amg8833;

void setup() {
  Wire.begin(); // for connecting with AMG8833
  amg8833.begin(); // begin AMG8833 comm
  Serial.begin(115200); // larger baud rate for sending all 64 pixel values
}

void loop() {
  // Print the temperature of each pixel
  for(unsigned char i = 0; i < 64; i++){
    Serial.print(amg8833.getPixelTemperature(i));
    Serial.print(",");
  }
  // end print with return
  Serial.println();
  // short delay between sends
  delay(50);
}
On the MATLAB side, we have to read the 64 AMG8833 pixels as a string from the serial port, convert each to a double, rearrange them as a 8x8 grid, and plot them onto our figure. This is done in the code given below:
% MATLAB data for reading Arduino serial prinout data
instrreset % reset all serial ports
s = serial('COM6'); % change this to desired Arduino board port
set(s,'BaudRate',115200); % baud rate for communication
fopen(s); % open the comm between Arduino and MATLAB
out = fscanf(s); % read data
data_str = split(out,',');
n_vars = 64; % number of variables printed
data_array = zeros(n_vars,1);
for ii=1:n_vars
    data_array(ii) = str2double(data_str(ii));
end
data_grid = reshape(data_array,8,8);
imagesc(data_grid)
With the subsequent figure plotted out as a result:

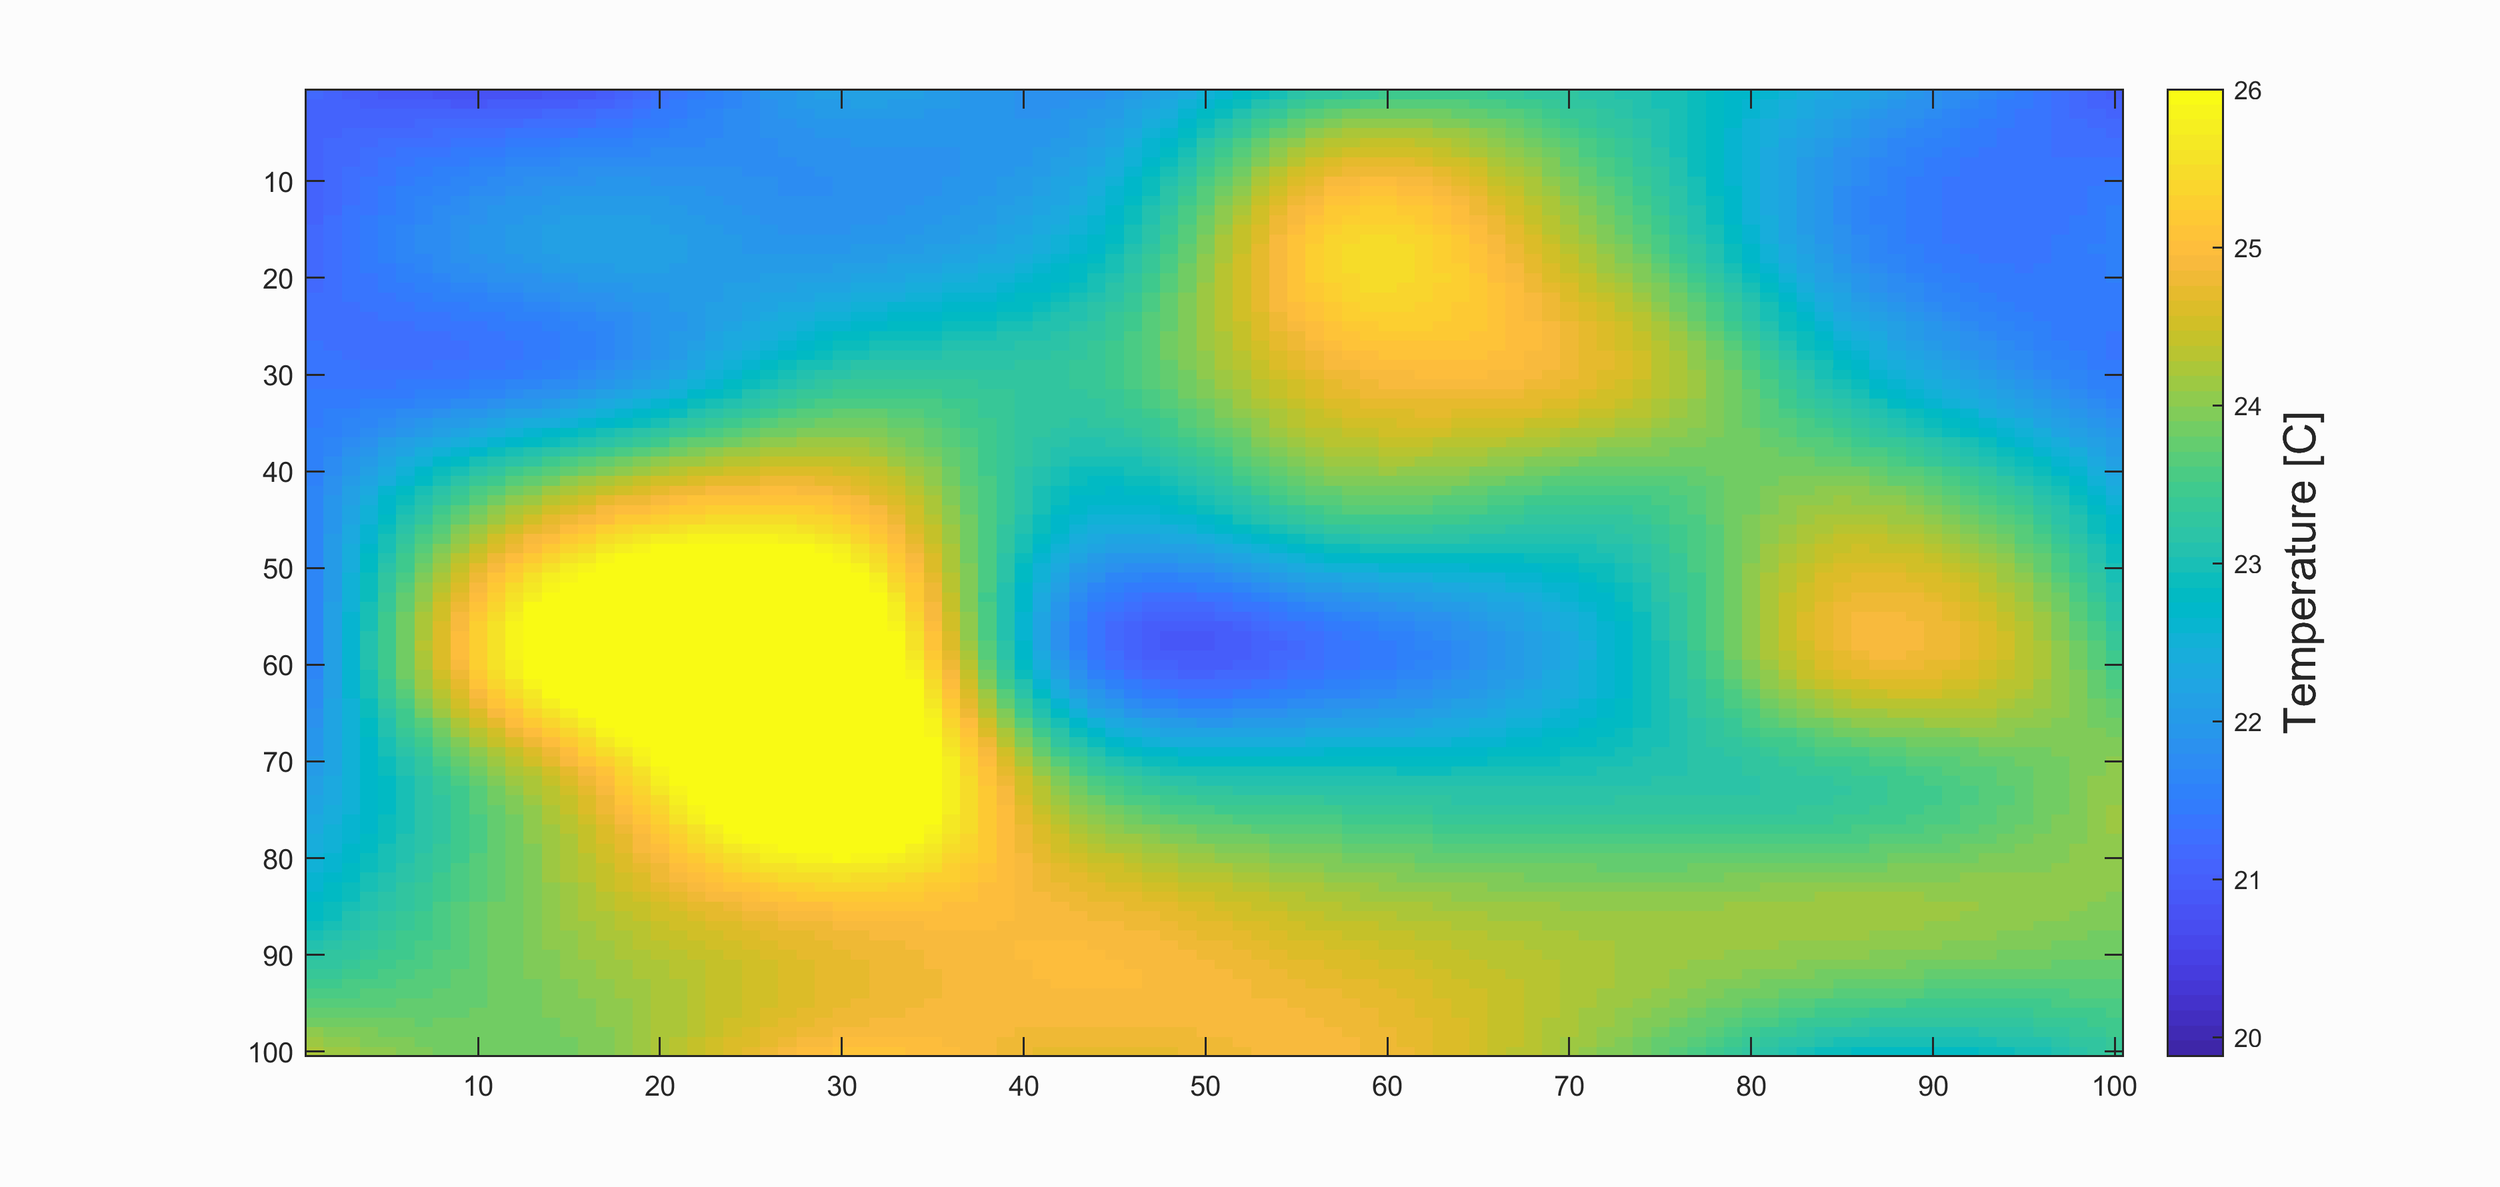
If we wanted to create a real-time plot, similar to the single-variable real-time plot above, we can incorporate a more complicated routine to plot the thermal camera in real time. I also included an interpolation scheme to scale up the pixels from 8x8 to 100x100. The code is shown below:
% MATLAB data for reading Arduino serial prinout data
instrreset % reset all serial ports
clear all
close all
clc

s = serial('COM6'); % change this to desired Arduino board port
set(s,'BaudRate',115200); % baud rate for communication
fopen(s); % open the comm between Arduino and MATLAB

% figure and axes parameters
f1 = figure();
screen = get(0,'screensize');
fig_span = 0.75; % figure size 90% of screen
set(gcf,'Position',[((1.0-fig_span)/2.0)*screen(3),((1.0-fig_span)/2.0)*screen(4),...
    (fig_span*screen(3))-((1.0-fig_span)/2.0)*screen(3),(fig_span*screen(4))-((1.0-fig_span)/2.0)*screen(3)],...
    'color',[252.0,252.0,252.0]/256.0)
loop_break = true; % dummy variable to exit loop when BREAK is pressed
dialogBox = uicontrol('Style', 'PushButton', 'String', 'Break Loop','Callback', 'loop_break = false;');
% plot zeros so we can just update it later
[x_locs,y_locs] = meshgrid(1:8);
[x_interp,y_interp] = meshgrid(1:0.07:8-.07); % interpolate 8x8 to 100x100

% Sensor noise measurement
% for this: place a large object with uniform temperature in
% front of sensor (book, wall, table) - this is a psuedo calibration
out = fscanf(s); % read data
data_parse = split(out,','); % split by comma
data_array = zeros(64,1);
for ii = 1:64
    data_array(ii) = str2double(data_parse(ii)); % convert to double
end
noise = reshape(data_array,[8,8]);
mean_noise = mean(mean(noise)); % calculate mean noise
noise = noise-mean_noise; % subtract mean noise from each pixel's noise

plot_bounds = [mean_noise-2 26]; % plot bounds - If colder or hotter are expected  - this may be changed
while loop_break
    out = fscanf(s);
    data_parse = split(out,',');
    data_array = zeros(64,1);
    for ii = 1:64
        data_array(ii) = str2double(data_parse(ii));
    end
    data_array = reshape(data_array,[8,8])-noise;
    cla()
    % interpolate and plot onto image
    data_interp = interp2(x_locs,y_locs,data_array,x_interp,y_interp,'cubic');
    imagesc(data_interp,plot_bounds)
    c1 = colorbar; % colorbar for temperature reading
    ylabel(c1,'Temperature [C]','FontSize',16)
    pause(0.05) % briefly pause to allow graphics to catch-up
end
The resulting output should produce real-time images that look similar to the one shown below (and also the GIF at the top of this page):
MATLAB is a powerful processing tool used by researchers and data analysts because of its vast set of libraries and wide-reaching community of users. In this tutorial, MATLAB’s serial tool was used to read Arduino data from the serial port in real time. This type of procedure could be useful for real-time data acquisition and data visualization. In the particular example given above, the AMG8833 thermal camera was used to create real-time thermal imagery. Thermal imagery can be used to diagnose hotspots in machine health, intruder alert systems, HVAC leakage detection, and much more. This short introduction into data acquisition with MATLAB acts as a starting point for anyone interested in interfacing their computer with Arduino, while also harnessing the powerful computational power of MATLAB.
See More in MATLAB and Data Analysis: