Force Sensitive Resistors (FSRs) with Arduino
“As an Amazon Associates Program member, clicking on links may result in Maker Portal receiving a small commission that helps support future projects.”
Many thanks to PCBgogo for sponsoring this project. PCBgogo is a quickturn PCB fabrication & PCB assembly manufacturer in China with over 10 years experience. They offer low-cost, high-quality PCB prototyping and assembly at a minimum of 5 pieces - meaning you can scale up your project as needed!

A force sensitive resistor (FSR) is comprised of a conductive polymer material pressed between two electrode layers, giving it the ability to electrically respond to changes in stress and strain. FSRs are often used in ergonomic or rehabilitation applications where pressure is applied from human interaction and the response is recorded or translated. Force sensitive resistors are incredibly useful for human interactivity because of their slim profile, inexpensive construction, and multiplicative geometries. The sensor used in this tutorial is the RP-S40-ST (datasheet can be found here), which is a 40mm x 40mm thin film FSR. An Arduino board will be used to read the analog signals outputted by the FSR in a voltage divider configuration, where the force applied to the FSR can be approximated using the sensor’s calibration curve. The theory and application of force sensing using the FSR is introduced from an engineer’s perspective, with an emphasis on using the calibration curve produced by the manufacturer - with an additional calibration check. This ensures that the sensor is behaving as expected, and any modifications can be made based on drift or hysteresis of the sensor.
The physics of a force sensitive resistor is outside the context of this tutorial, however, the function relating the applied force (or pressure or mass) and the change in resistance of the FSR is the most important relationship in this entire tutorial. For the FSR used in this tutorial, the RP-S40-ST, the relationship between mass and resistance is given in its datasheet, where the mass is given as a function of the measured resistance of the FSR. This function is given below for reference:
where RFSR is the resistance of the FSR, and mi is the mass added atop the FSR. When plotted, the equation looks as follows:
This curve will help us relate the force (due to gravity for each added mass) to resistance. However, if we wanted to read this value with a microcontroller, we need to wire the FSR in series with a resistor of known value, which will help us approximate the resistance of the FSR as a function of voltage drop across the known resistor. This voltage divider circuit can be visualized as follows:

where the variable resistance of the FSR is labeled as RFSR, the known resistance value, R0, is selected, Vcc is the supply voltage, and Vmeas is the voltage measured by the Arduino's analog to digital (ADC) converter. This voltage divider methodology will allow for approximation of force incident upon the FSR, which will be outputted as a voltage value. Thus, the voltage divider equation can be used in conjunction with the calibration curve to relate measured voltage to added mass:
Solving for RFSR in the voltage divider equation:
And finally, inserting back into the added mass calibration equation:
This is a powerful result because it states that with a known resistance value wired in series with an FSR, along with a measurement of the voltage across the known resistor results in the approximate mass (or force) incident on the FSR. The difficulty of approximating force is that it relies on the knowledge of the area being pressed, which is not always known. This is why the area is often set and known masses calibrated are added, thus resulting in an approximate force due to gravity. This equation relating a known resistance and voltage measurement will be used to approximate force and mass in upcoming sections.
Plotting voltage as a function of both measured FSR resistance and added mass (with an R0 value of 4.7 kΩ, and Vcc value of 5.0V) gives the following:
And now it is easy to see how the increase in voltage is actually a result of a lowering of the internal resistance of the piezoelectric material within the FSR, which is a result of added mass or pressure to the sensor. Depending on the measurement range of interest, the selected resistance value can be changed. The desired sensitivity and measurement equipment will determine the viable range of the output, which is directly proportional to the known resistor value. Below is a plot of different known resistance values as a function of voltage over a range of added mass values:
An important observation can be made regarding the selection of the known resistor value: for better sensitivity at higher forcing - chose a lower known resistance value; for better sensitivity at lower forcing - choose a higher known resistance value. A 4.7kΩ resistor was chosen for this analysis because the masses used to test the FSR stay around 1kg. If larger masses or forces were used, the recommendation is to go for a lower known resistance value to increase sensitivity at those larger values.

As described above, the RP-S40-ST is to be wired to the Arduino board using a voltage divider configuration with a 4.7kΩ resistor. Thus, the main components required to follow along in this tutorial are as follows:

A force sensitive resistor (FSR) is comprised of a conductive polymer material pressed between two electrode layers, giving it the ability to electrically respond to changes in stress and strain. FSRs are often used in ergonomic or rehabilitation applications where pressure is applied from human interaction and the response is recorded or translated. Force sensitive resistors are incredibly useful for human interactivity because of their slim profile, inexpensive construction, and multiplicative geometries. The sensor presented here is the RP-S40-ST (datasheet can be found here), which is a 40mm x 40mm thin film FSR.
Included in the 40mm Force Sensitive Resistor Kit:
1x RP-S40-ST Force Sensitive Resistor
Features of the 40mm Force Sensitive Resistor (RP-S40-ST):
36mm x 36mm Active Sensing Area
0.42mm Thick
0.1N - 100N Force Sensitivity
Adhesive Bottom to Prevent Slipping
Compatible with Arduino and Raspberry Pi
Full tutorial on wiring and usage can be found here on our blog.
1x 40mm Force Sensing Resistor - $10.00 [Our Store]
1x 4.7kΩ Resistor - $12.00 (525pcs) [Amazon]
1x Arduino Uno Board - $13.00 [Our Store]
5x Jumper Wires (Male-to-Male) - $0.45 [Our Store]
1x Mini Breadboard - $3.00 [Our Store]
1kg Calibrated Masses Kit - $16.50 (8pcs 10g - 500g) [Amazon]
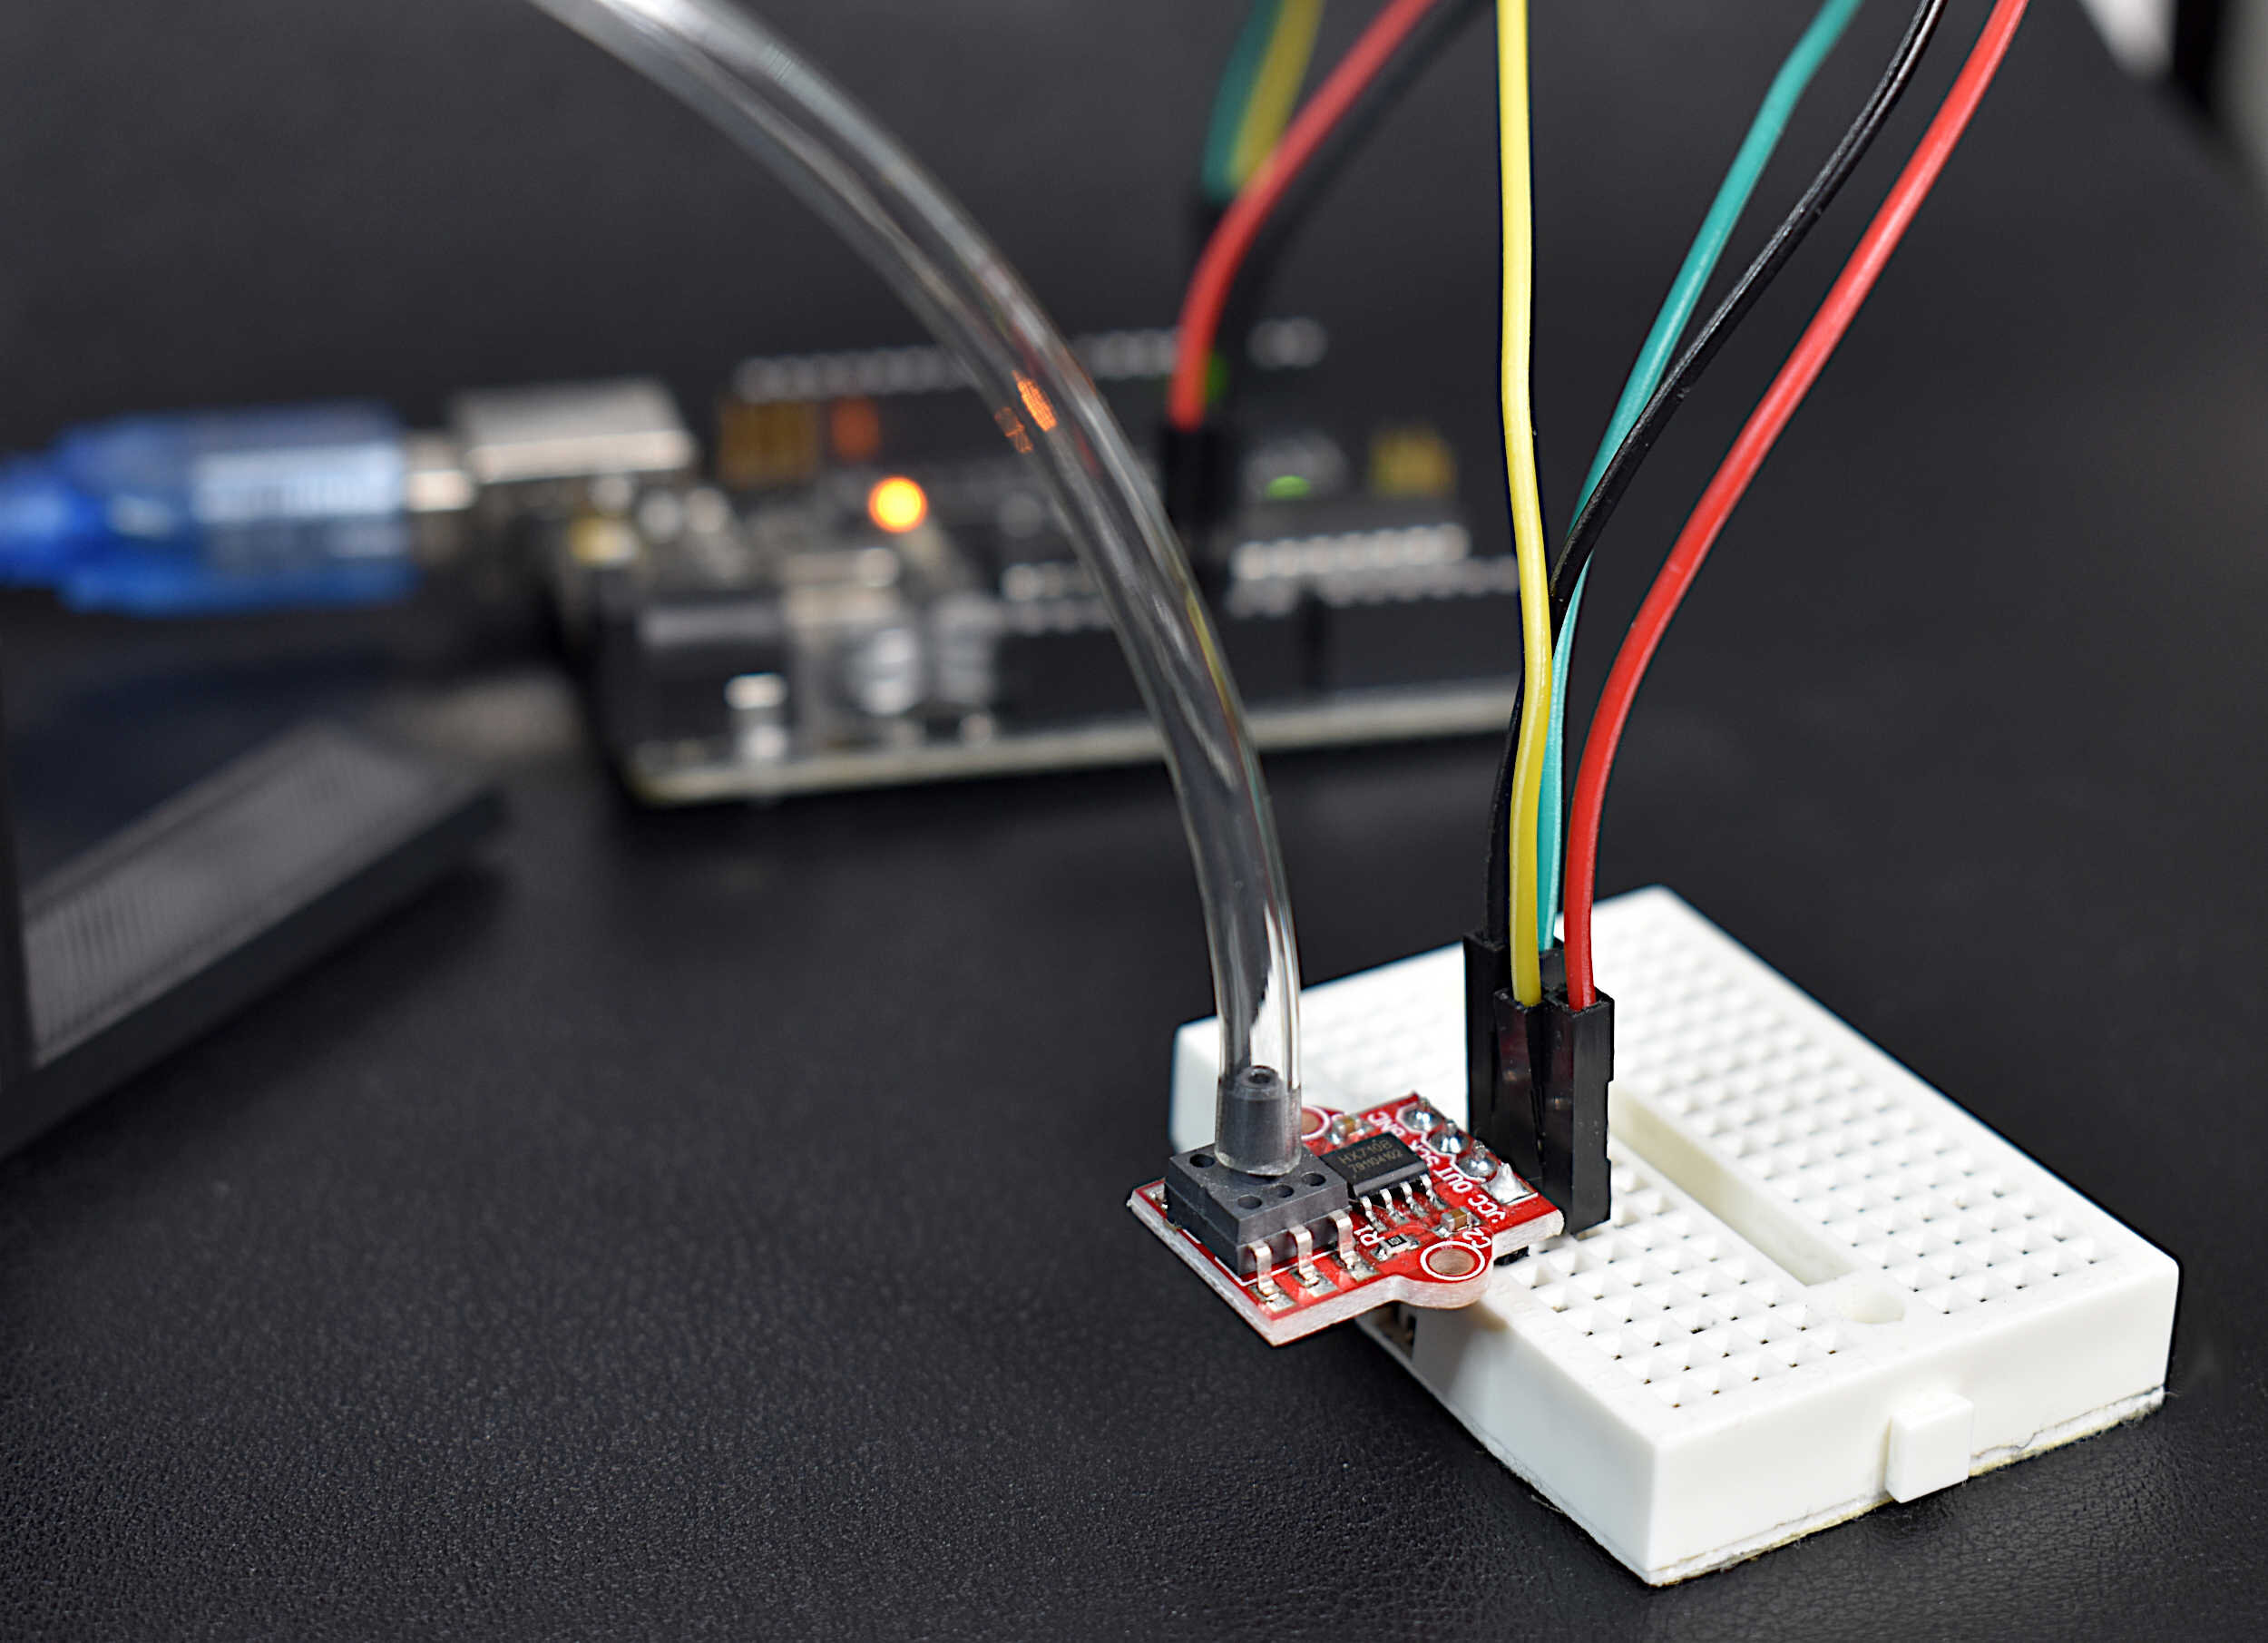
It is recommended that the FSR is either soldered (be careful, the FSR can get damaged if heated too much) or attached to a breadboard directly. The problem with wiring the FSR directly to a breadboard is that it creates an awkward setup. Thus, we solder ours directly to jumper wires and place heat shrink around the connections.
The wiring diagram is given below, which follows the recommendation of a voltage divider established between the FSR and a 4.7kΩ resistor. The Arduino is measuring the voltage drop across the 4.7kΩ resistor:
Now that the Arduino is wired to the FSR voltage divider circuit, we can begin to take test measurements and investigate the response of the FSR and how it behaves in reference to the calibration discussed in the previous section.
The datasheet for the RP-S40-ST cites a range of 10g - 10kg, but 10kg is fairly large to calibrate without a force tester (which we do not have in our lab!). Thus, the testing region for the FSR in this case is 20g - 1.1kg (more on this later). First, an Arduino code must be created which prints out resistance values from the FSR. This code is given below:
// RP-S40-SR Force Sensing Resistor
// Printing out resistance values from the voltage divider

int FSR_pin = A0;    // select the input pin for the potentiometer
int avg_size = 10; // number of analog readings to average
float R_0 = 4700.0; // known resistor value in [Ohms]
float Vcc = 5.0; // supply voltage

void setup() {
  Serial.begin(9600);
}

void loop() {
  float sum_val = 0.0; // variable for storing sum used for averaging
  float R_FSR;
  for (int ii=0;ii<avg_size;ii++){
    sum_val+=(analogRead(FSR_pin)/1023.0)*5.0; // sum the 10-bit ADC ratio
    delay(10);
  }
  sum_val/=avg_size; // take average

  R_FSR = (R_0/1000.0)*((Vcc/sum_val)-1.0); // calculate actual FSR resistance

  Serial.println(R_FSR); // print to serial port
  delay(10);
}
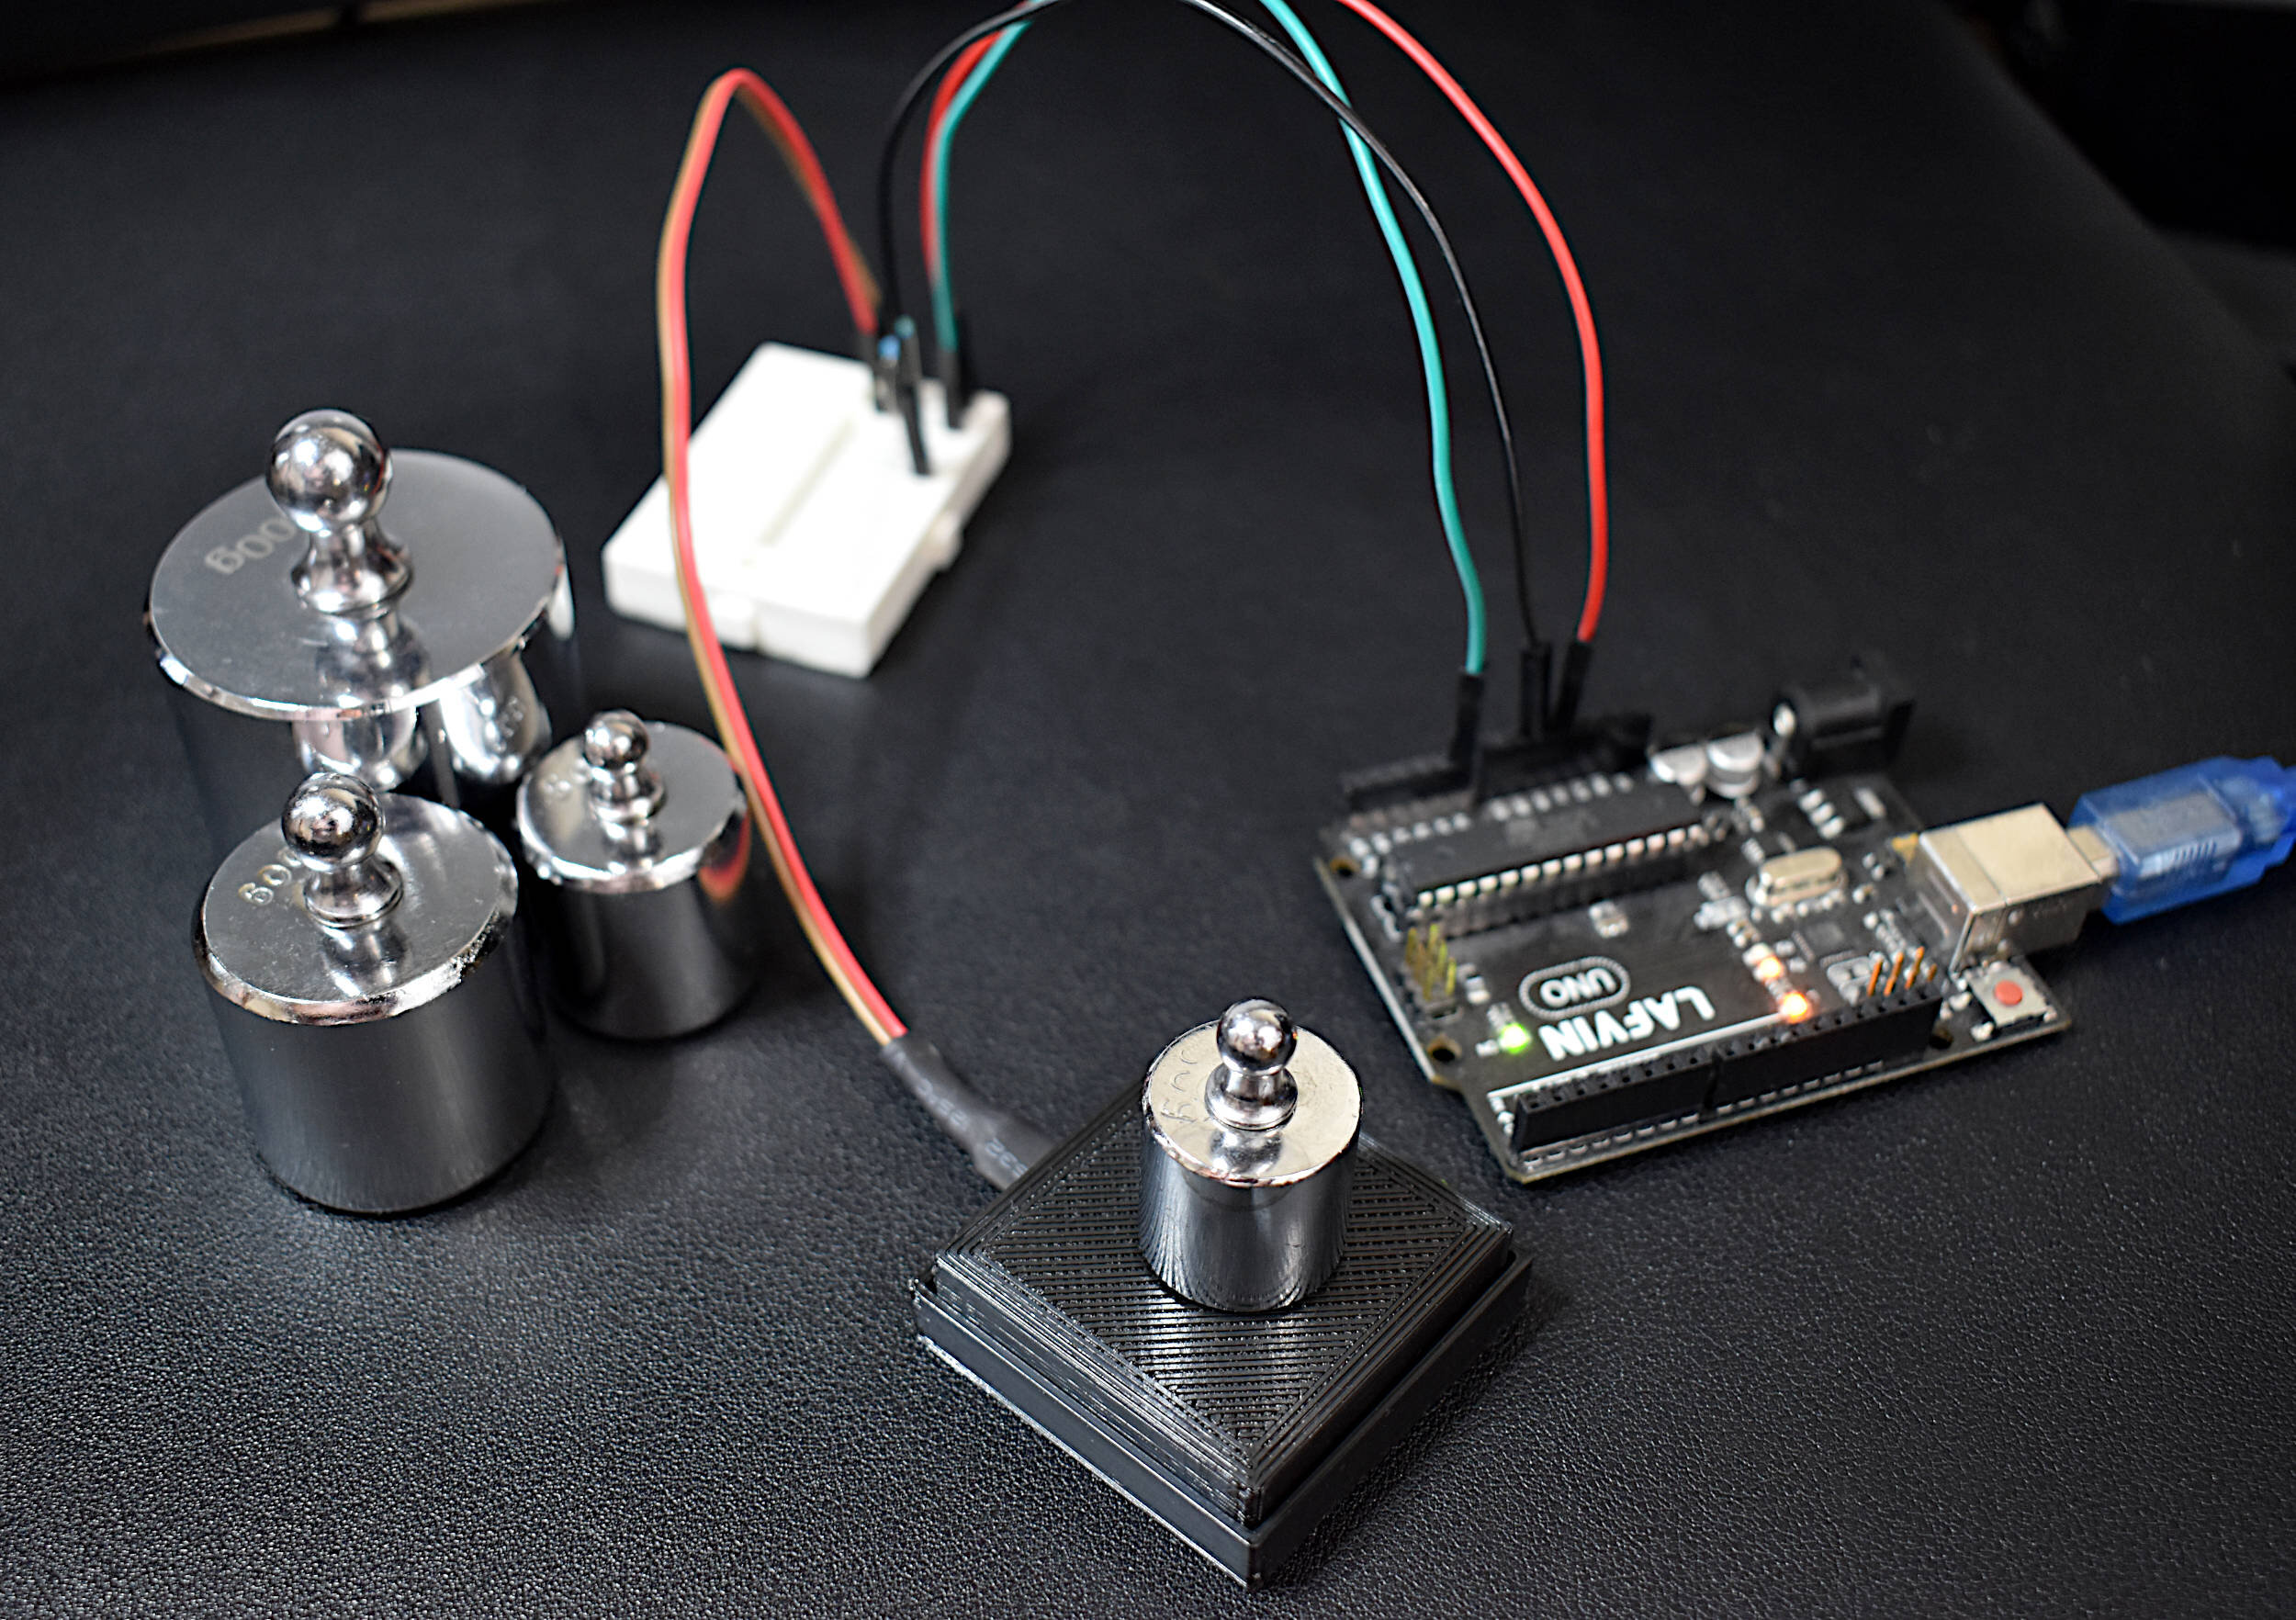
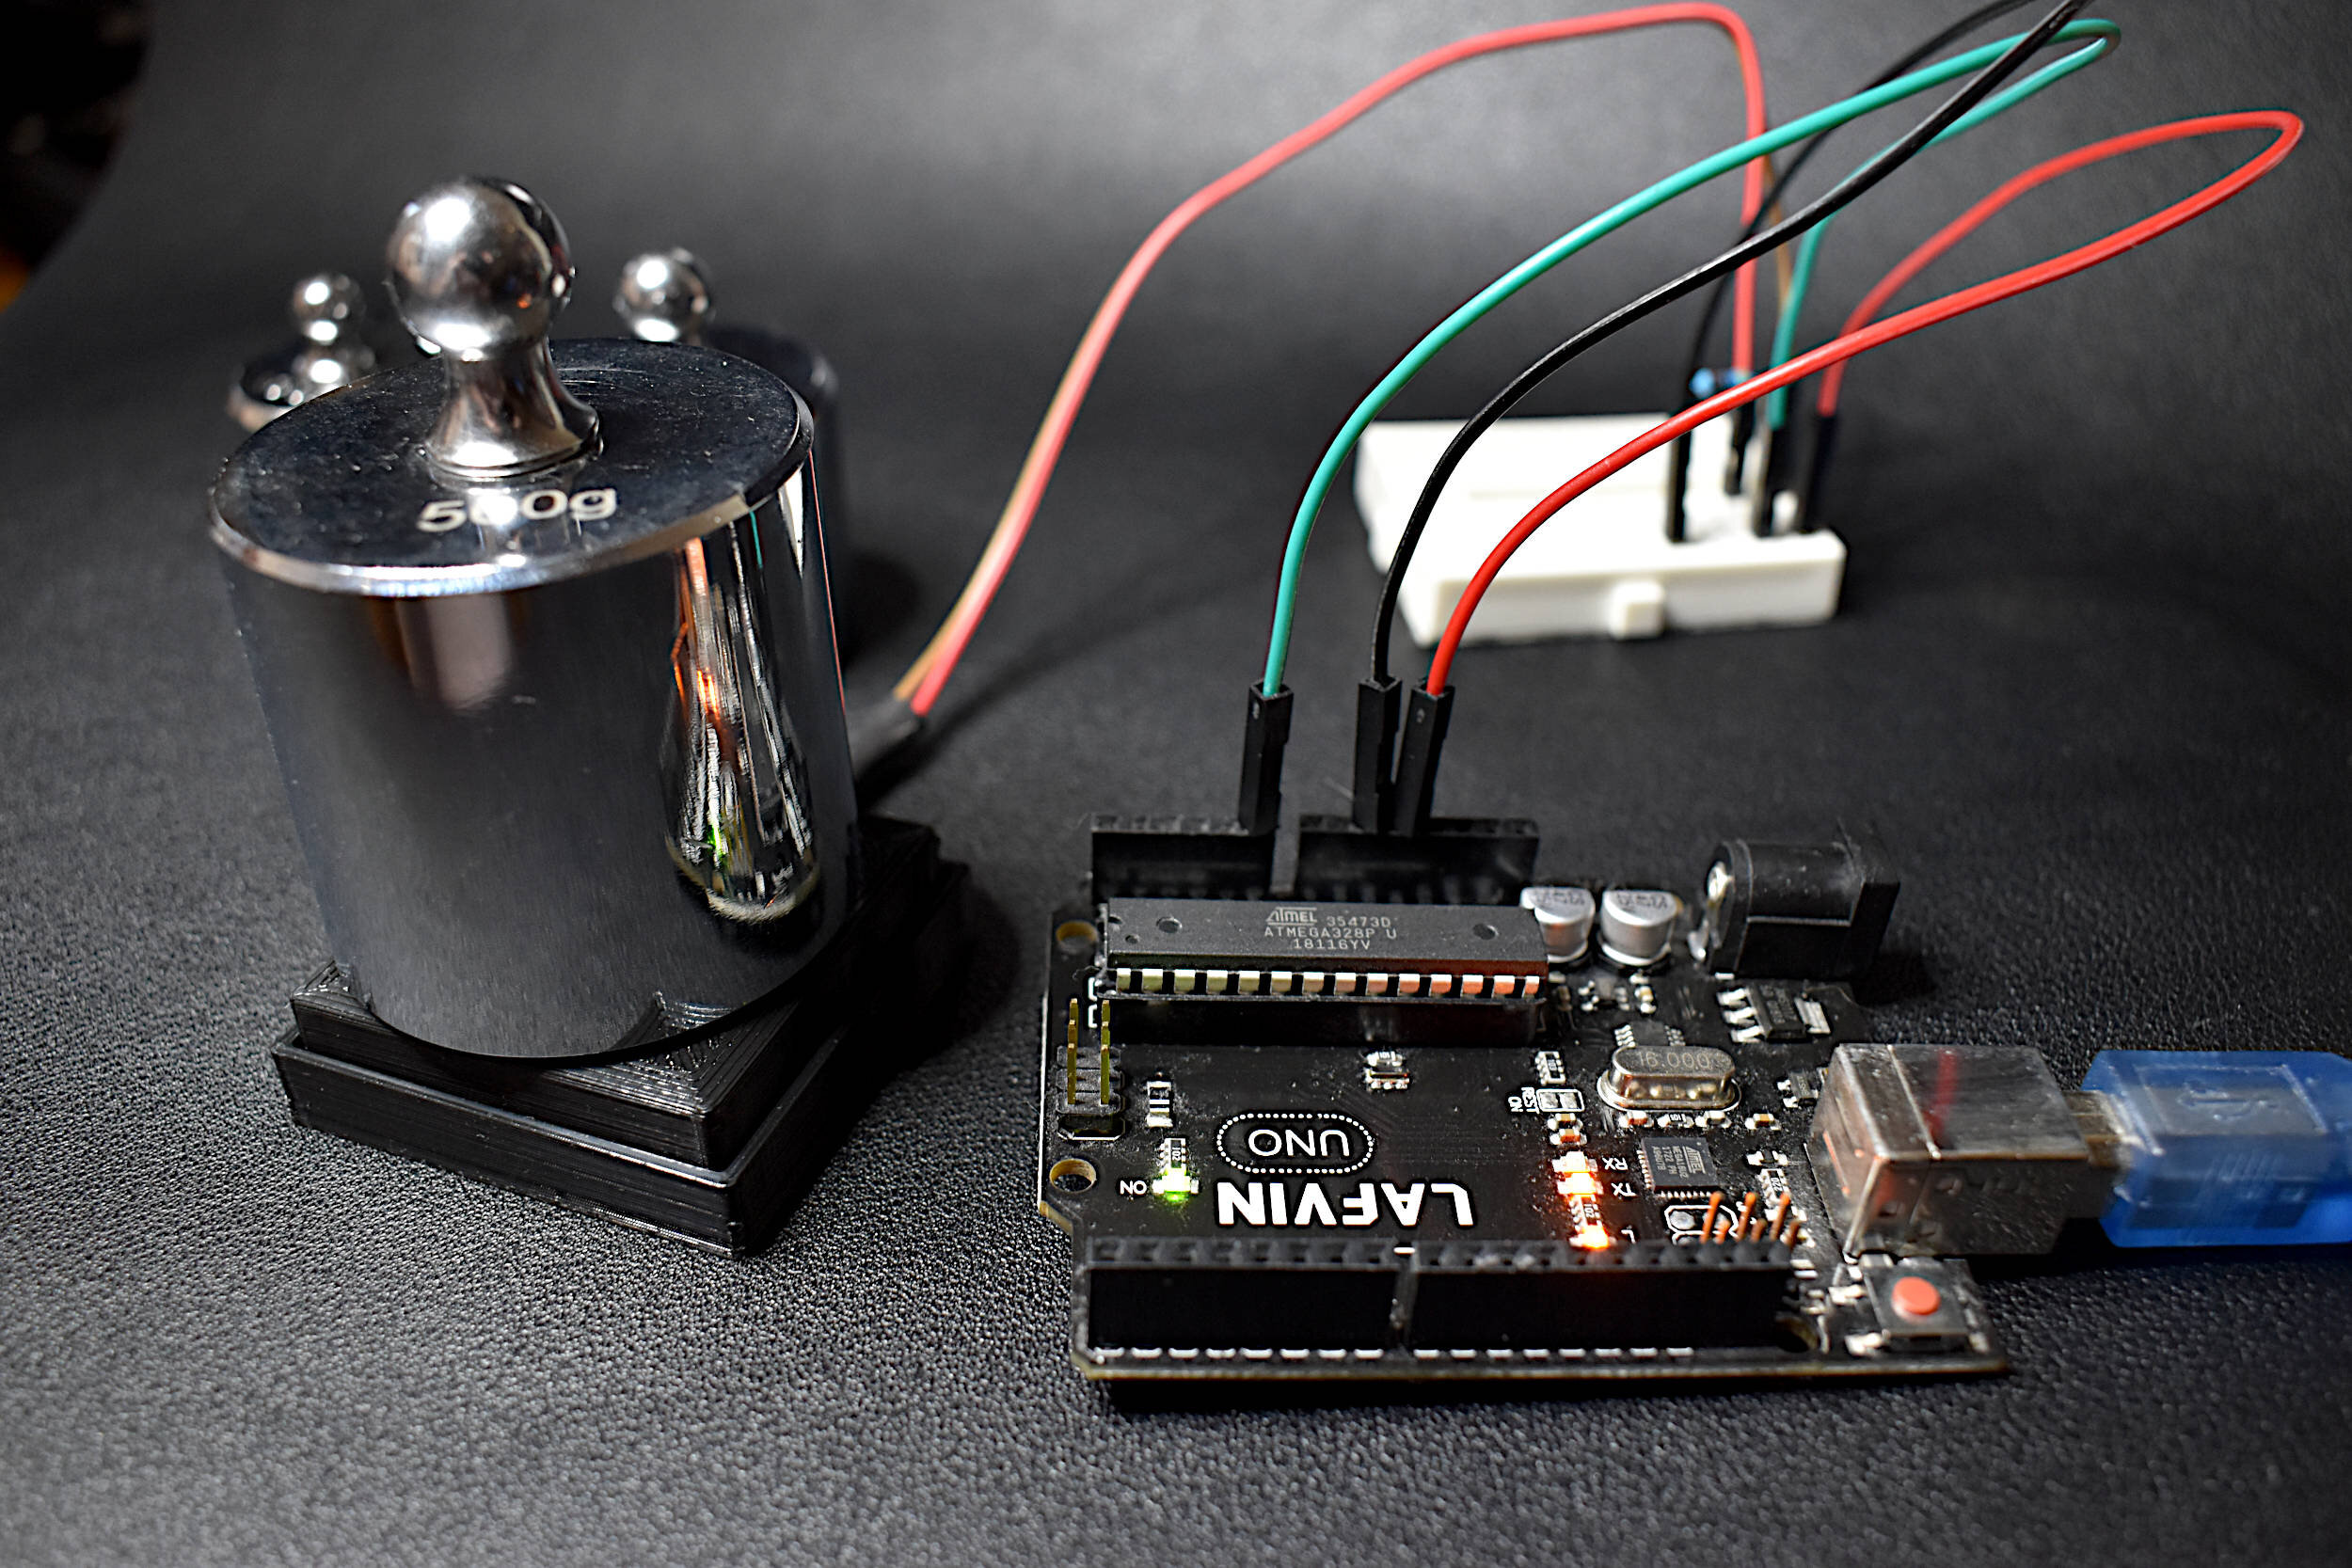
Once the RP-S40-ST is wired to the Arduino board and the code is uploaded, the output can be viewed in the Arduino IDE’s serial monitor and plotter. Upon pressing on the FSR, the output should decrease, as plotted above for the resistance as a function of force. For smaller forces, the response may be highly variable and non-repeatable. This is due to the uneven distribution of pressure along the FSR, in conjunction with the high resistivity at those forces. Thus, it is also recommended that a device be used that maintains consistency in its forcing area - such as a piston. This will ensure the calibration of the FSR is accurate and not misleading due to variations in forcing area. In our case, we 3D printed a 15mm x 15mm plate that will hold the calibrated masses to be added atop the FSR. The 3D printed plate weighs roughly 6g, which is accounted for in all calculations (weight was measured by a load cell).
A demo of the code above is shown in the video below:
After some tests, it was obvious that the RP-S40-ST sensor that was being tested in our lab was not behaving as described in the datasheet. This could be due to several reasons such as testing area or manufacturer’s error, however, it was concluded that a calibration was necessary. Thus, a set of calibrated masses were assembled as part of the calibration procedure, where the force due to gravity was to act as the calibration method.
The calibration procedure was simple:
Place calibrated masses atop the 3D printed platform of the RP-S40-ST force sensing resistor
Measure the resulting resistance value outputted by the FSR using Arduino
Curve fit the resulting resistance vs. mass profile based on the log-log linear fit
Perform independence tests to verify the fit
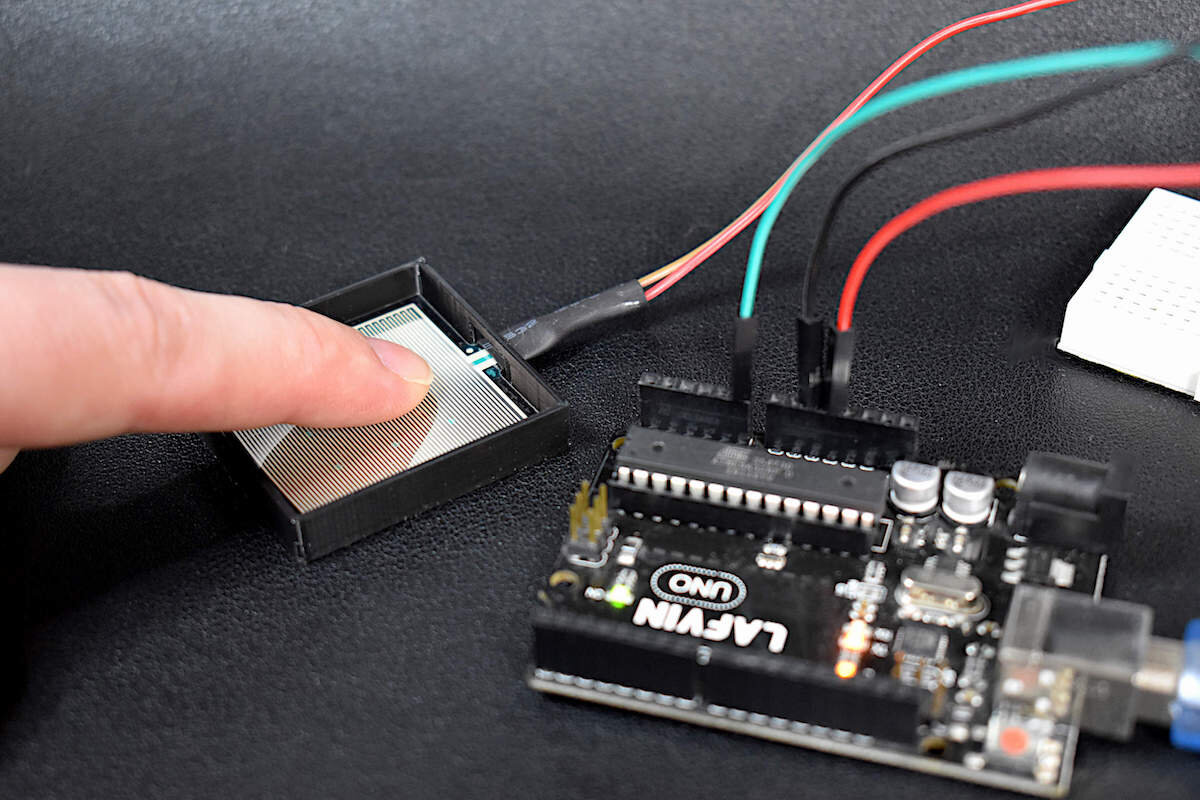
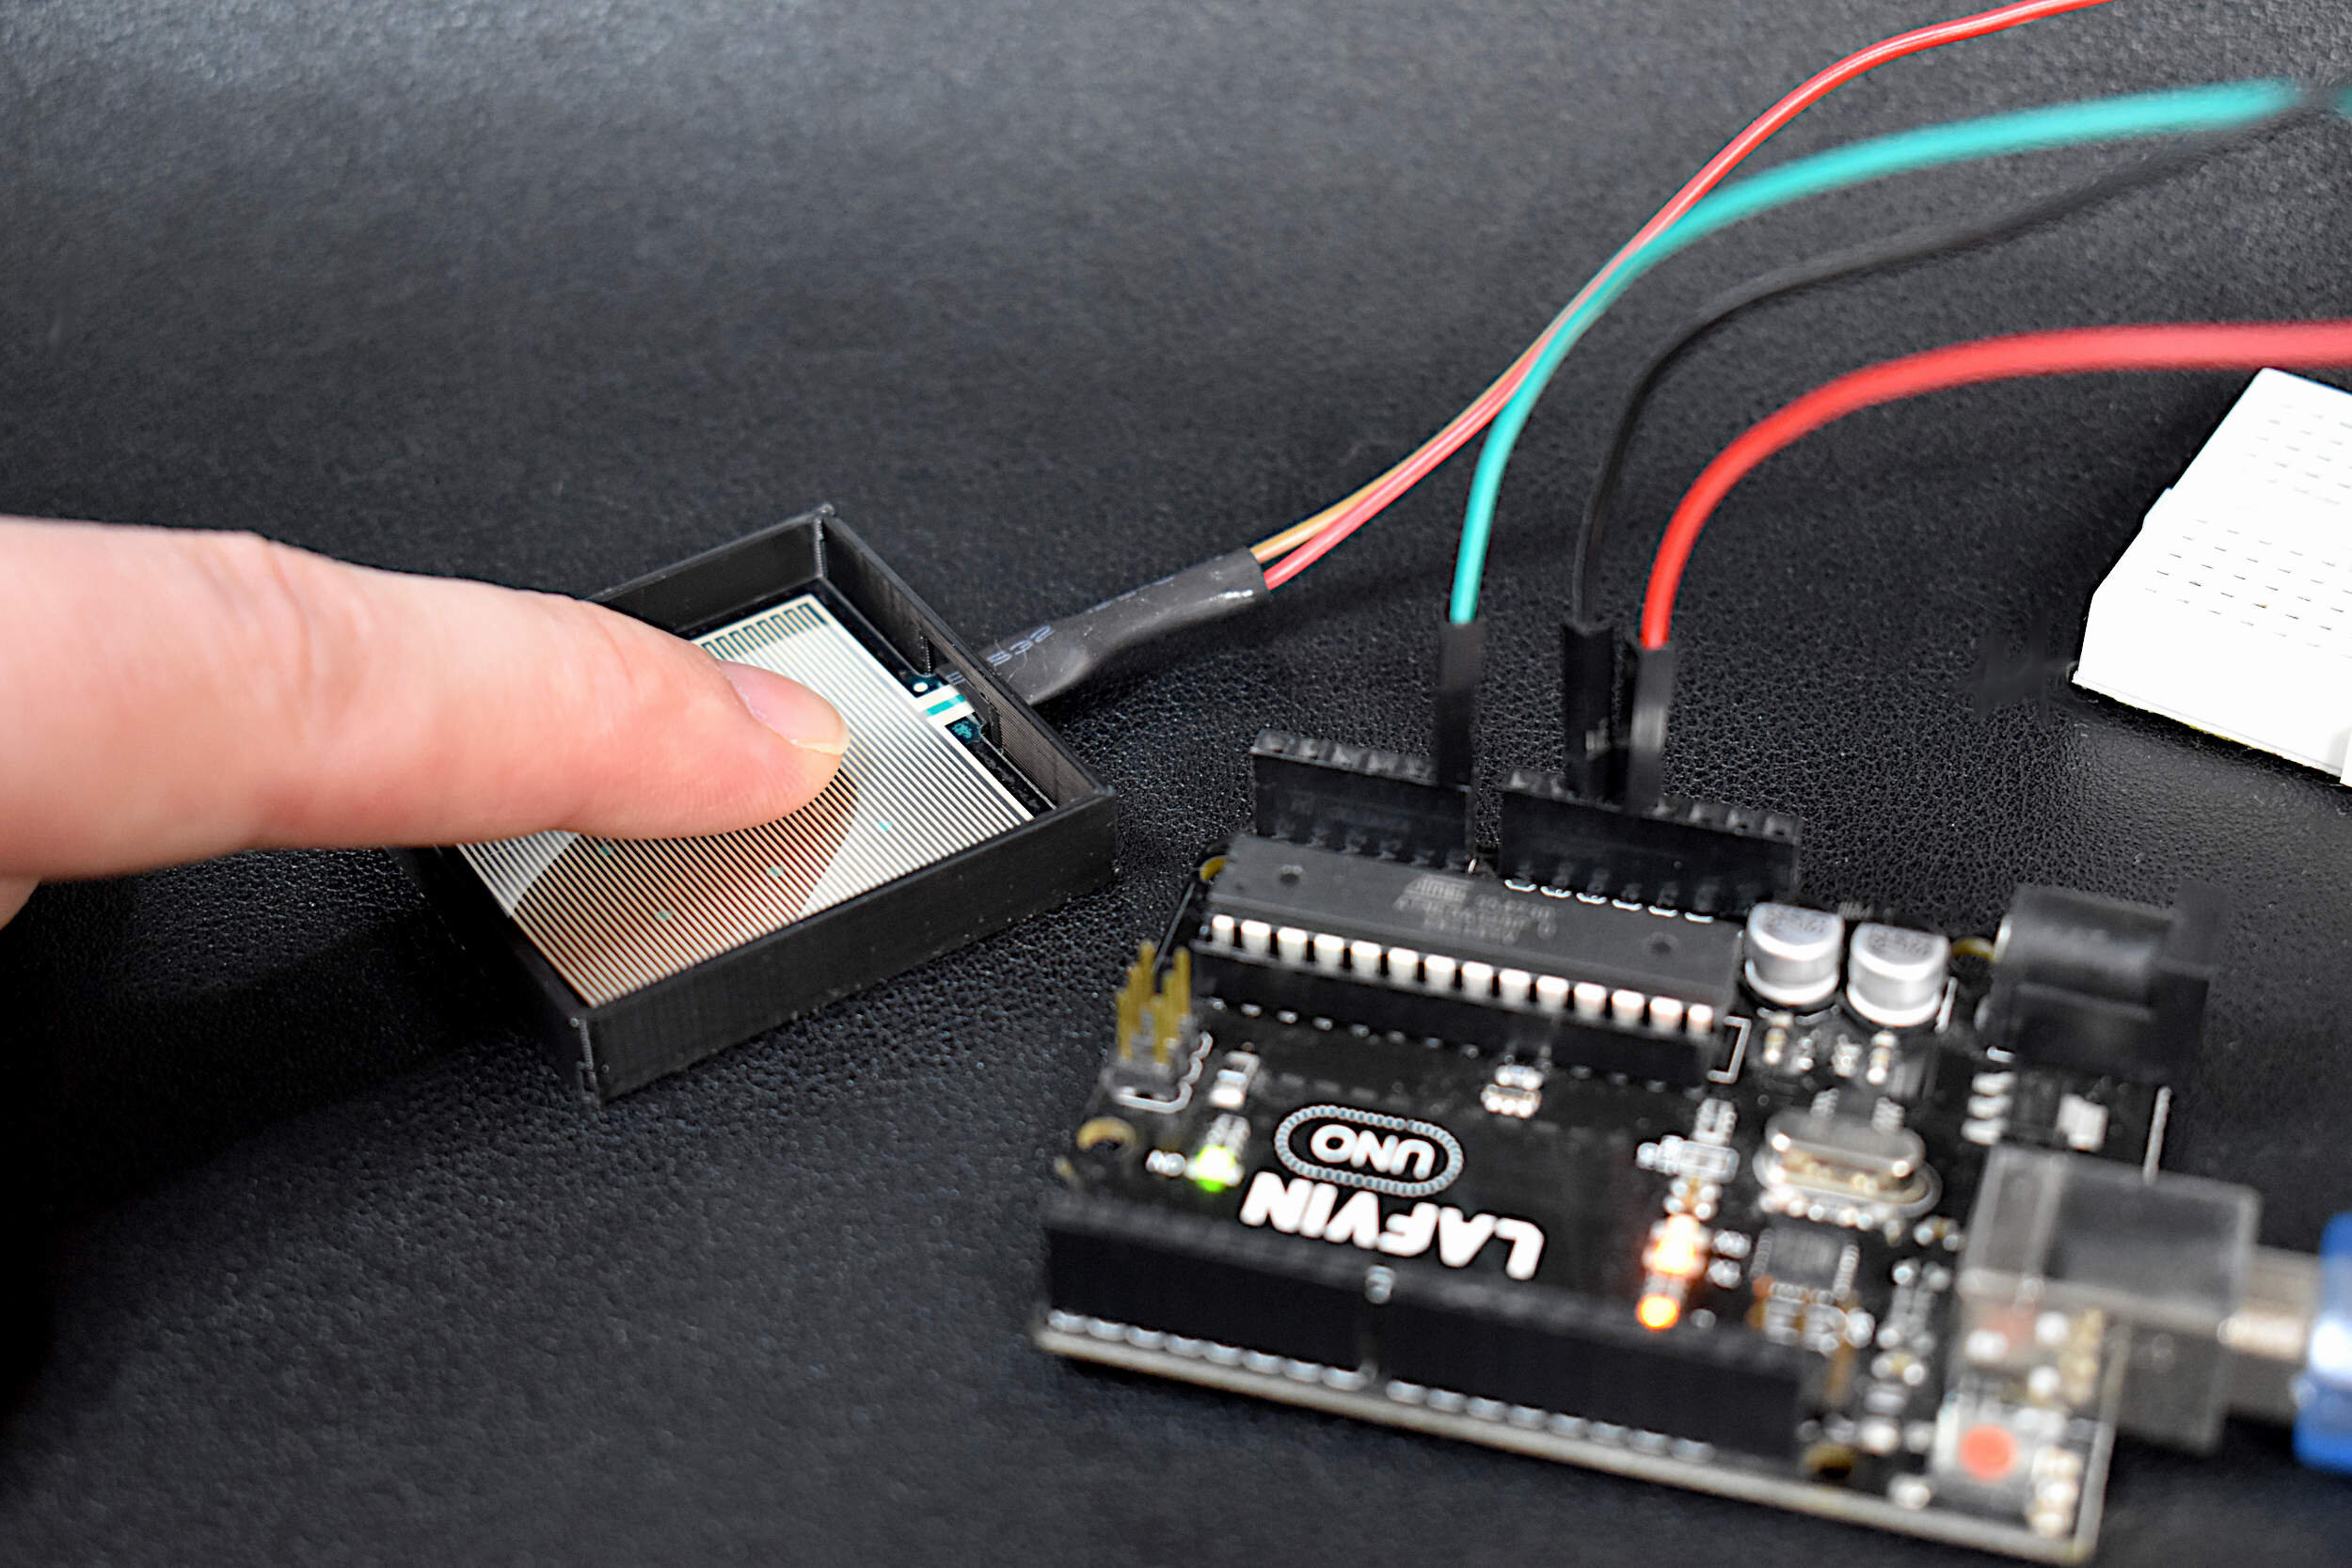
Calibration Setup for the RP-S40-ST Force Sensing Resistor
In our case, Python was used to log the mass and resistance values, as well as fit them to the log-log curve prescribed in the datasheet. Our calibration results are given in the figure below:

The log-power relationship mentioned in the figure above can be written as follows:
where mi is an instantaneous mass value, RFSR is the instantaneous resistance value outputted by the Arduino, and a,b are calibrated coefficients. This is the procedure outlined in the datasheet and replicated here. One thing to note is that the calibration curve and fit given here is different from that of the datasheet. This is likely due to differing calibration areas, i.e. the 15mm x 15mm plate used to calibrate our FSR is likely smaller than that used by the manufacturer. After some calculations, it appears they used a 25mm x 25mm plate instead. However, we chose 15mm due to its proximity to the size of the human finger.
Below is an independent validation of the FSR, where the coefficients a,b from the data above were used to predict the data shown in green below:

For reference, the coefficients found in our case were:
a = -1.47943801
b = 2.97969738
Both the validation and calibration data showed an error of roughly 20% when compared to the actual added masses.
A video demonstration of the calibrated masses being added to the FSR is shown below, with the implemented prediction function:
The final implementation of the FSR is given in the video below, where the 3D printed plate has been removed in order to test the sensor’s response to direct human interaction:
A few observations can be made upon viewing the video above:
The FSR has a rapid temporal response to changes in force
The response of the FSR has a high rate of repeatability for similar pressures
The RP-S40-ST is highly sensitive
All of these observations are reasons why FSRs are great for applications in flexible and rapid force measurement. FSRs are particularly useful when traditional force sensors are cumbersome, such as an application in foot pronation. FSRs can also be found in biomedical devices where precise pressure measurement is fundamental to the working principle of the mechanism. For example, an artificial limbs may want a rapid but proportional response to touch, similar to a human’s. Thus, an FSR can be used to simulate the rapid force response, while also having a slim profile that fits seamlessly into the limb.
The final inversion to replicate the mass prediction (for our particular sensor) is as follows:
Thus, if we wanted to return to the original function of mass as a function of the FSR resistance, it would take the following form:
Written out, we can see how it relates back to the curve stated in the datasheet:
This tutorial explores force sensing resistors (FSRs) with Arduino and how to test and calibrate them. The calibration method is based on the force of gravitation and uses calibrated masses, along with a 3D printed plate that allows consistent force impact over the calibration process. The resistance outputted by the FSR was fitted to the resulting added mass profile to find a function that best fits the prediction of the added masses. This curve, which was identified as a log-log linear curve, demonstrated an average error of about 20%. This indicates that around 1kg of force, we can expect an error of about ±200g. This may seem large, however, depending on the application - it can be acceptable. FSRs are great for applications where slim profile active pressure or force measurements are required. Thus, this exploration into FSRs is meant as an easing into the world of force measurements and a real-world application to Arduino.

Further resources on force sensing resistors, conductive polymer composites, and piezoresistive elements can be found at the following:
Hall RS, Desmoulin GT, Milner TE. A technique for conditioning and calibrating force-sensing resistors for repeatable and reliable measurement of compressive force. J Biomech. 2008;41(16):3492‐3495. doi:10.1016/j.jbiomech.2008.09.031
Interlink Electronics. FSR Force Sensing Resistors. https://www.generationrobots.com/media/FSR400-Series-Integration-Guide.pdf
Kalantari M, Dargahi J, Kövecses J, Mardasi MG, Nouri S. A New Approach for Modeling Piezoresistive Force Sensors Based on Semiconductive Polymer Composites. IEEE/ASME Transactions on Mechatronics. 2012;17(3): 572-581. doi: 10.1109/TMECH.2011.2108664.
Paredes-Madrid L, Matute A, Bareño JO, Parra Vargas CA, Gutierrez Velásquez EI. Underlying Physics of Conductive Polymer Composites and Force Sensing Resistors (FSRs). A Study on Creep Response and Dynamic Loading. Materials (Basel). 2017;10(11):1334. Published 2017 Nov 21. doi:10.3390/ma10111334
Sensitronics. Force Sensing Resistor Theory and Applications. https://www.sensitronics.com/fsr101.htm
See More in Engineering and Arduino: