Infrared Obstacle Detector for Less Than $1
Infrared (IR) light is identified in the electromagnetic spectrum as having wavelengths greater than the visible spectrum (400nm-700nm) but smaller than the microwave spectrum (1mm). Specifically, infrared light is useful because of its benign impact on humans (in most cases), its relation to blackbody radiation, and its wavelength-specific absorption of gases. Another lesser known application of infrared light is object obstacle detection. Using an IR receiver (photodiode) and transmitter (LED) pair, the distance between an object and the RX/TX pair can be approximated. I wrote a similar article on time-of-flight measurements using an ultrasonic sensor (view it here), however, that case used sound instead of light, and a pulse-response method. The IR setup has many issues with interference, but gains credibility in the affordability of the components (as low as $0.24, depending on your method of purchase), not to mention the smaller and lighter profile that the LED and photodiode boast compared to the drivers in the ultrasonic setup. Therefore, if the goal is affordability and weight - then the IR detection setup may be optimal.
The concept here is slightly different than a time-of-flight comparison. There is still a transmitter, except here it's constantly emitting light. The receiver is also constantly receiving but returns a voltage based on the amount of infrared light entering its diode. This voltage level can be used to approximate the distance of an object by determining the amount of IR light reflected back from the object. This method is also very sensitive to the emissivity of nearby objects, which results in the aforementioned interference issues (read about why on Wikipedia's emissivity and thermal radiation page here). The principal for approximating distance between an object and infrared sensor pair is based on a radiative transfer model for a point light source wherein the measured reflected infrared energy is fitted to an exponential profile and least-squares approximated.
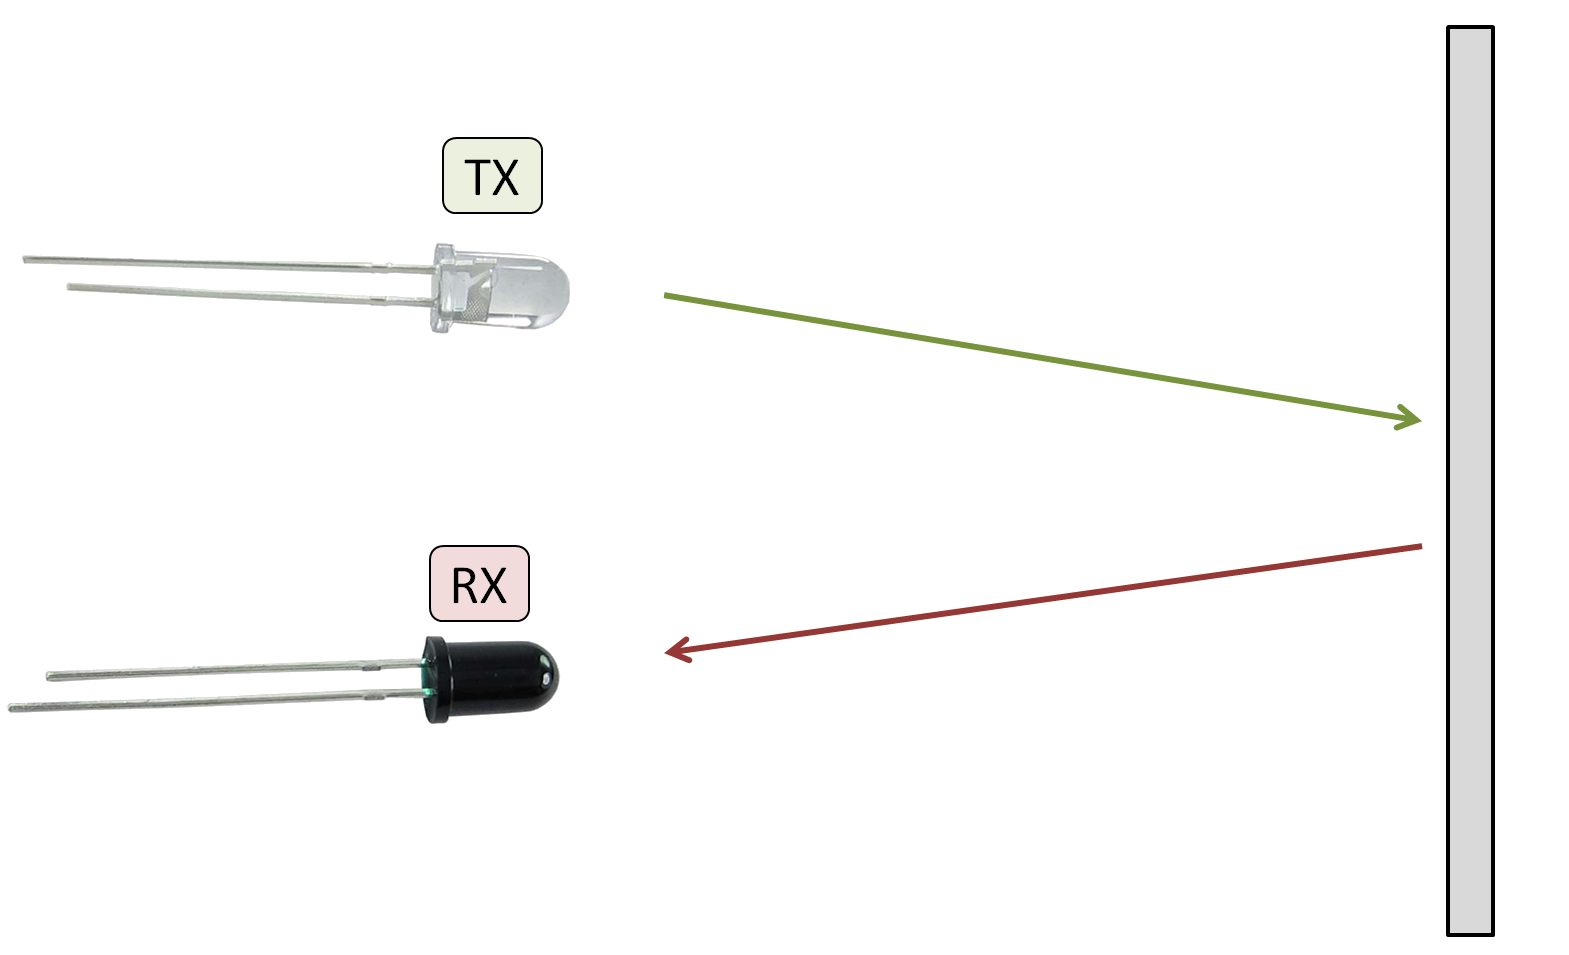
Figre 1: Principal mechanism for the IR object detection: the transmitter (LED) emits light, an object reflects a portion of that light, and the photodiode receives the IR light and records it in the form of voltage, which we will then fit to a curve to approximate distance based on the specific setup.
Wiring and Basic Code
The wiring and basic code below is based off of this tutorial. I recommend reading through that tutorial if you are lost or confused. This section is just to get the IR object detector system working. Once this section is finished, one should be capable of running the code and reading out simple values of voltage proportional to the distance between the sensors and an object.

Figure 2: Wiring diagram for the IR TX/RX pair
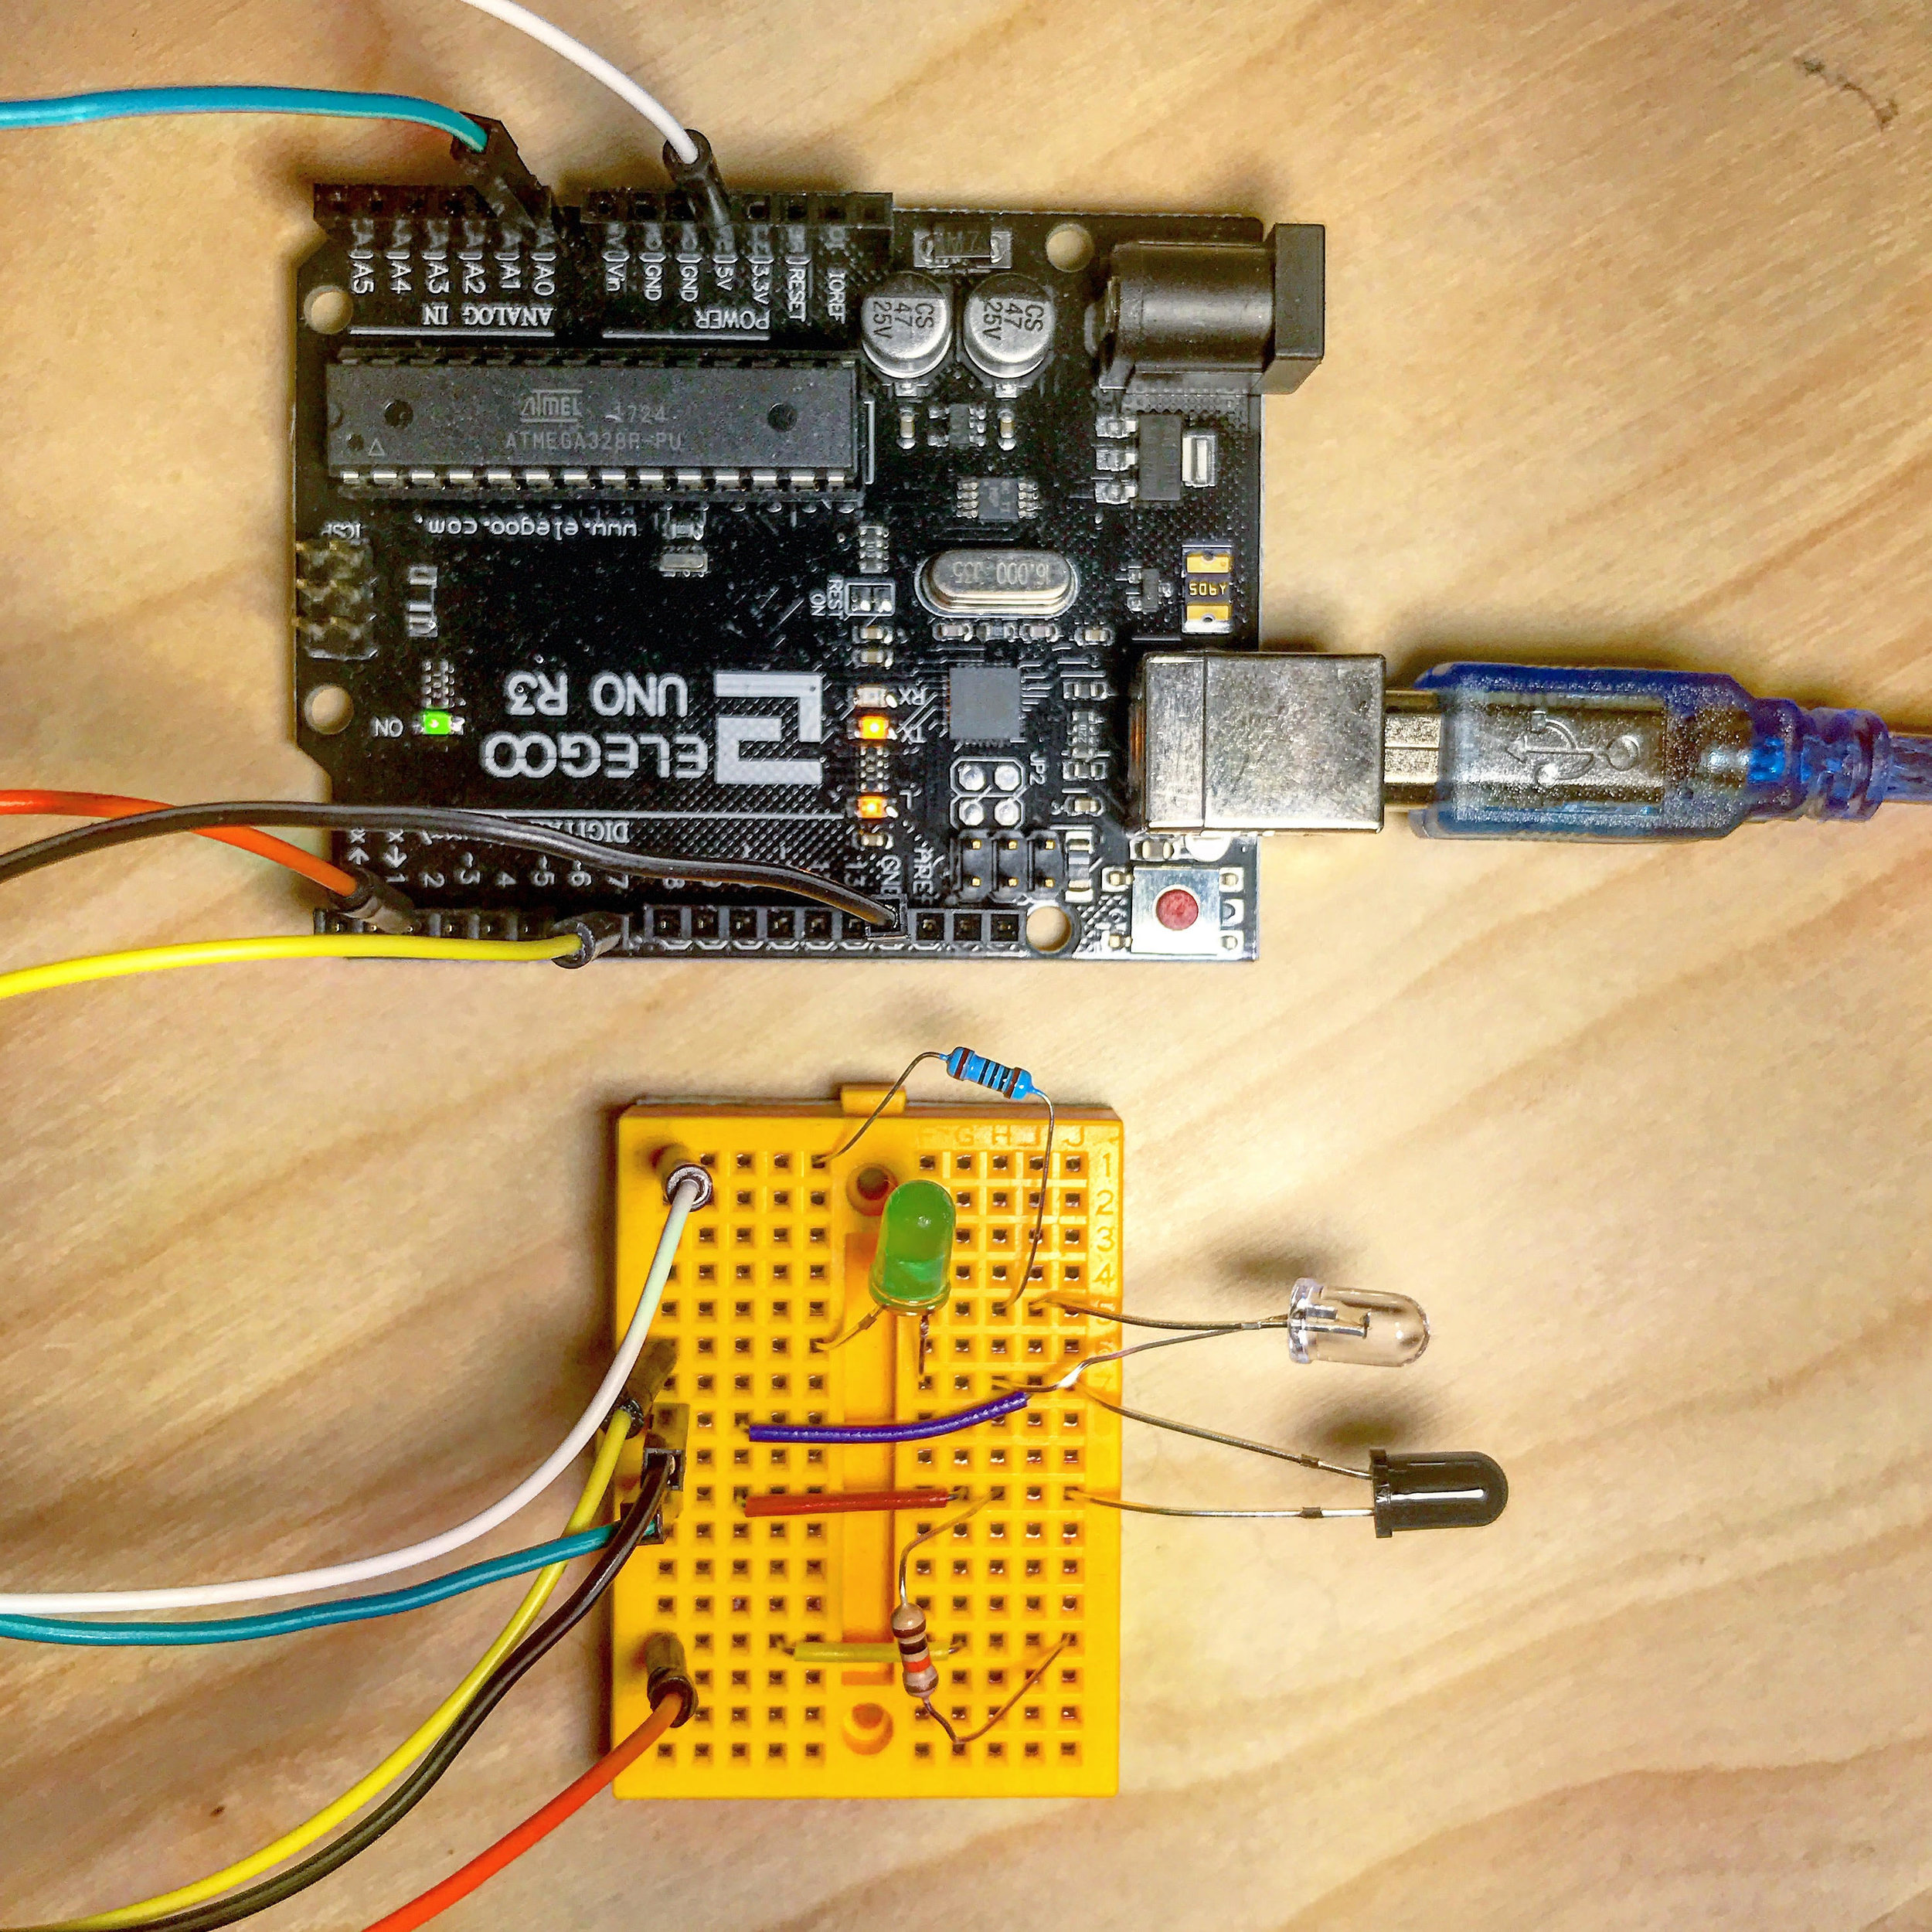
Figure 3: My setup that includes an LED. I chose to use an LED to notify when an object is within a certain distance.
int pd=2;                      //Photodiode to digital pin 2
int led=7;                   //LED to digital pin 7
int senRead=0;                 //Readings from sensor to analog pin 0
int limit = 900;            // play with system to find this limit
void setup()
 {
  pinMode(pd,OUTPUT);
  pinMode(led,OUTPUT);
  digitalWrite(pd,HIGH);       //supply 5 volts to photodiode
  digitalWrite(led,LOW);      // LED initially off
  Serial.begin(9600);
 }
void loop()
 {
  int val=analogRead(senRead);  //photodiode reading
  Serial.println(val);
  if(val <= limit)              //If obstacle is nearer than the Threshold range
  {
   digitalWrite(led,HIGH);     // LED will be ON
   delay(20);
  }
  else if(val > limit)          //If obstacle is not in Threshold range
  {
   digitalWrite(led,LOW);      //LED is OFF
   delay(20);
  }
 }
Focusing the Experiment
I first conducted the experiments using the bare LED and photodiode. But I soon realized there was too much interference (especially from human interaction) that caused distortion in the data. As a result, I shielded the RX/TX with electrical tape to stop non-axisymmetric reflections from influencing the data. You can see the taped receiver and transmitter in the photo below next to the tape measure.

Shielded IR TX/RX
Figure 4: I chose to shield the transmitter and receiver because of the interference from nearby objects. The shielding ensures that no bias is incorporated when calibrating and using the system.
Recording and Processing the Data
The process for recording the data is simple:
Record voltages at various known locations on a tape measure (using the code above)
Fit the data in Python, MATLAB, etc.
Use the fit and reinsert back into the code above to get real-time approximations of distance
The best method for fitting the data is to assume a logarithmic decay of the light wave and then fit that using least-squares methods. This is the simplest method that binds the physical with statistical. The basis for the logarithmic fit should obew the following form:
If the above variables are fitted, then you should get something that looks like the figure below, which is voltage on the x-axis and calculated/recorded distance on the y-axis. I split the fit into 3 parts because there are 3 clear distinctions of behavior. I also did this because of inherint limitations on the Arduino board with significant digits. Nevertheless, you can see that the data is fitted quite nicely using least-squares fits of a logarithmic profile. Below, the fits are 4th order, 1st order, and 4th order.
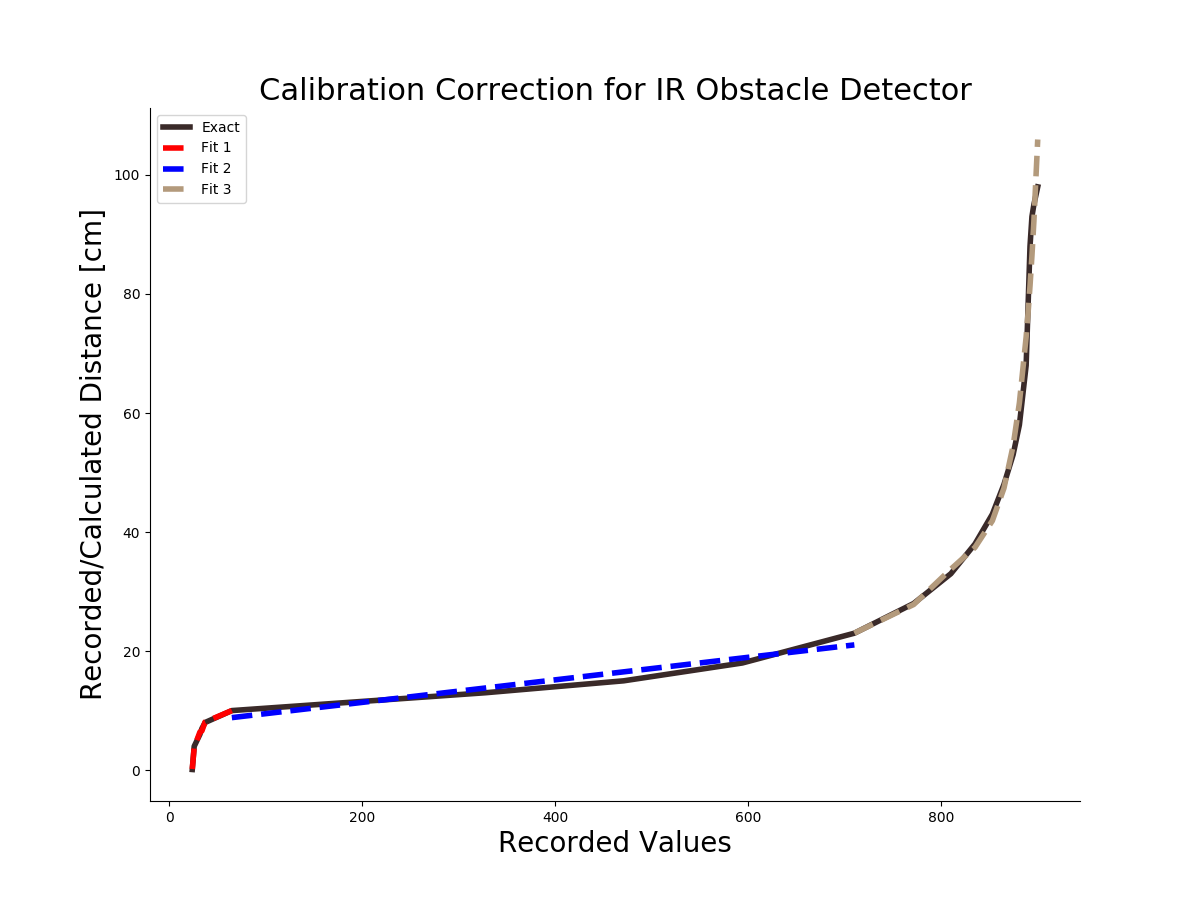
Figure 5: This plot shows my particular fit for the data I acquired using the method above. I used a 3-part fit because of the poor fit that 1 or 2 fits have and the limitations of Arduino's significant digits. The three types of fits are: 4th order exponential (in red), 1st order linear (in blue), and 4th order natural exponential (in brown). These fits comprise the model for the results section below.
Implementing the Least-Squares Fit
Below is the Arduino code that contains the real-time distance algorithm that implements the fit parameters. The least-squares constants are labeled a1,a2, and a3, and are allocated float variables because of their magnitude and amount of significant digits. Below in the code is also made sure to invert the calculation by using Arduino's 'exp()' command, which returns the natural exponent of the fitted voltage. The variable 'dist_approx' should readout approximate distance between an object and the TX/RX pair. The code is very flexible depending on your specific system. It's likely that many of the parameters like 'threshold', 'n_size', and the 'if statement' loops will need to be changed for your specific case.
// Code for Fitted IR Distance Measurements

int photo_reader = A0;    // analog pin for the photodiode
int photo_digital = 2;      // digital output for photodiode bias
int threshold = 35;      // limit threshold for the near-sensor area
float n_size = 1000; // size of average for each measurement

// Preallocations

volatile float avg_vals=0.0;
volatile int kk = 1;
volatile float dist_approx = 0;
volatile float dist_prev = 0;
float a1[5] = {-3.02617732e-04,4.85572993e-02,-2.79503782e+00,6.94301329e+01,-6.27056670e+02}; // fit for near-sensor
float a2[2] = {0.01456996,8.68924828}; // fit for linear section
float a3[5] = {7.40954457e-09,-2.34343249e-05,2.77620059e-02,-1.45955933e+01,2.87569286e+03}; // fit for far away
volatile float raw_reading = 0;

void setup() {
  //
  pinMode(photo_digital, OUTPUT);
  digitalWrite(photo_digital,HIGH);
  Serial.begin(9600);
}

void loop() {
  float val = analogRead(photo_reader);
  avg_vals+=val;
  if (kk>=n_size){
    raw_reading = avg_vals/n_size;
    //Serial.println(raw_reading); //If you want to read the raw values
    if(raw_reading<threshold){
      dist_approx = a1[0]*pow(raw_reading,4)+a1[1]*pow(raw_reading,3)+a1[2]*pow(raw_reading,2)+a1[3]*raw_reading+a1[4];
    } else if (raw_reading>threshold and raw_reading<700){
      dist_approx = a2[0]*pow(raw_reading,1)+a2[1];
    } else{
      dist_approx = a3[0]*pow(raw_reading,4)+a3[1]*pow(raw_reading,3)+a3[2]*pow(raw_reading,2)+a3[3]*raw_reading+a3[4];
      dist_approx = exp(dist_approx);
    }
    Serial.println(dist_approx);
    if (dist_approx>150 or dist_approx<0){
      //can alter this to skip values less than zero or values greater than a desired threshold
    } else if(dist_approx>1.05*dist_prev or dist_approx<0.95*dist_prev){
      if (dist_approx>5*dist_prev or dist_approx<0.9*dist_prev){
        //Serial.println(dist_approx); \\ uncomment to print values that change a certain amount
      } else{
        //Serial.println(dist_approx);
      }
      //Serial.println(" cm");
      dist_prev = dist_approx;
    }
    //Serial.println(dist_approx);
    avg_vals = 0.0;
    kk = 1;
  }
  kk++;
}
Results
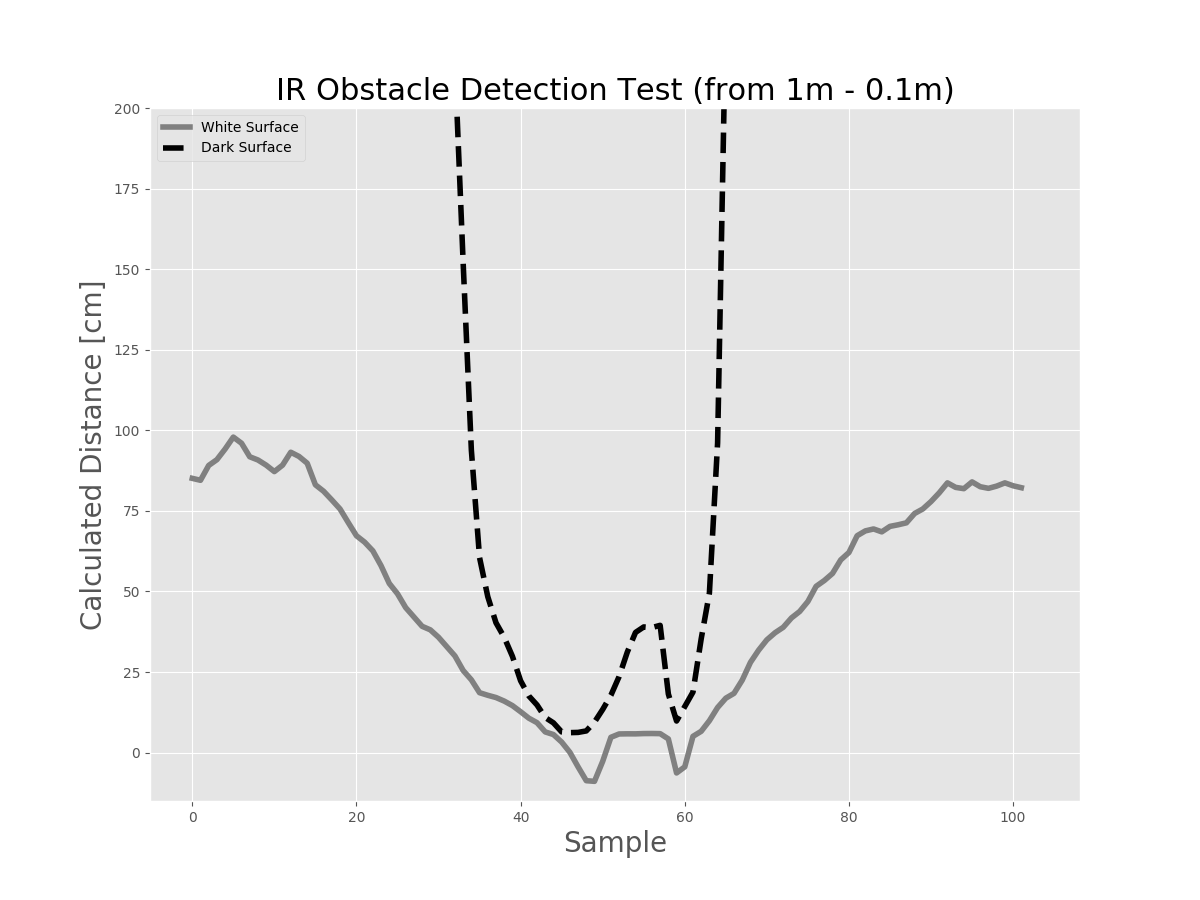
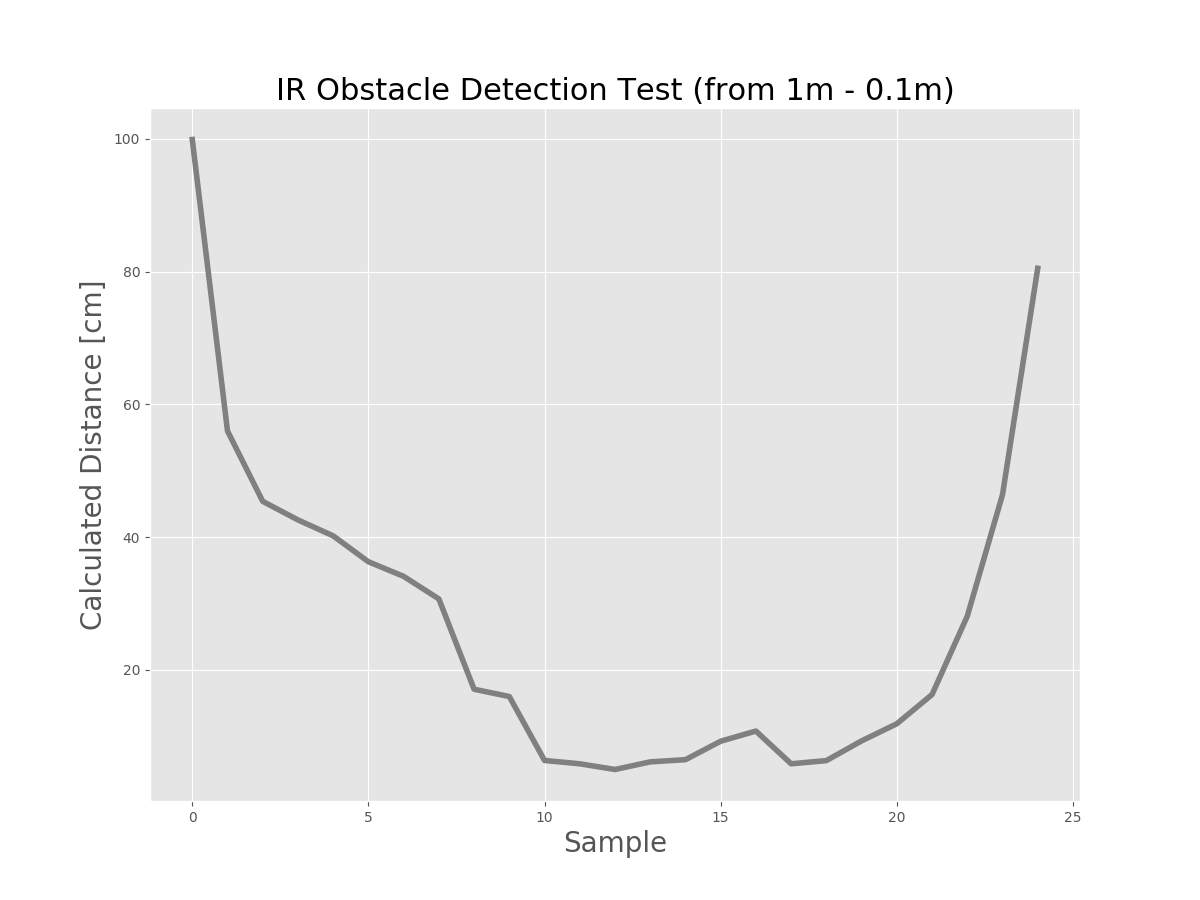
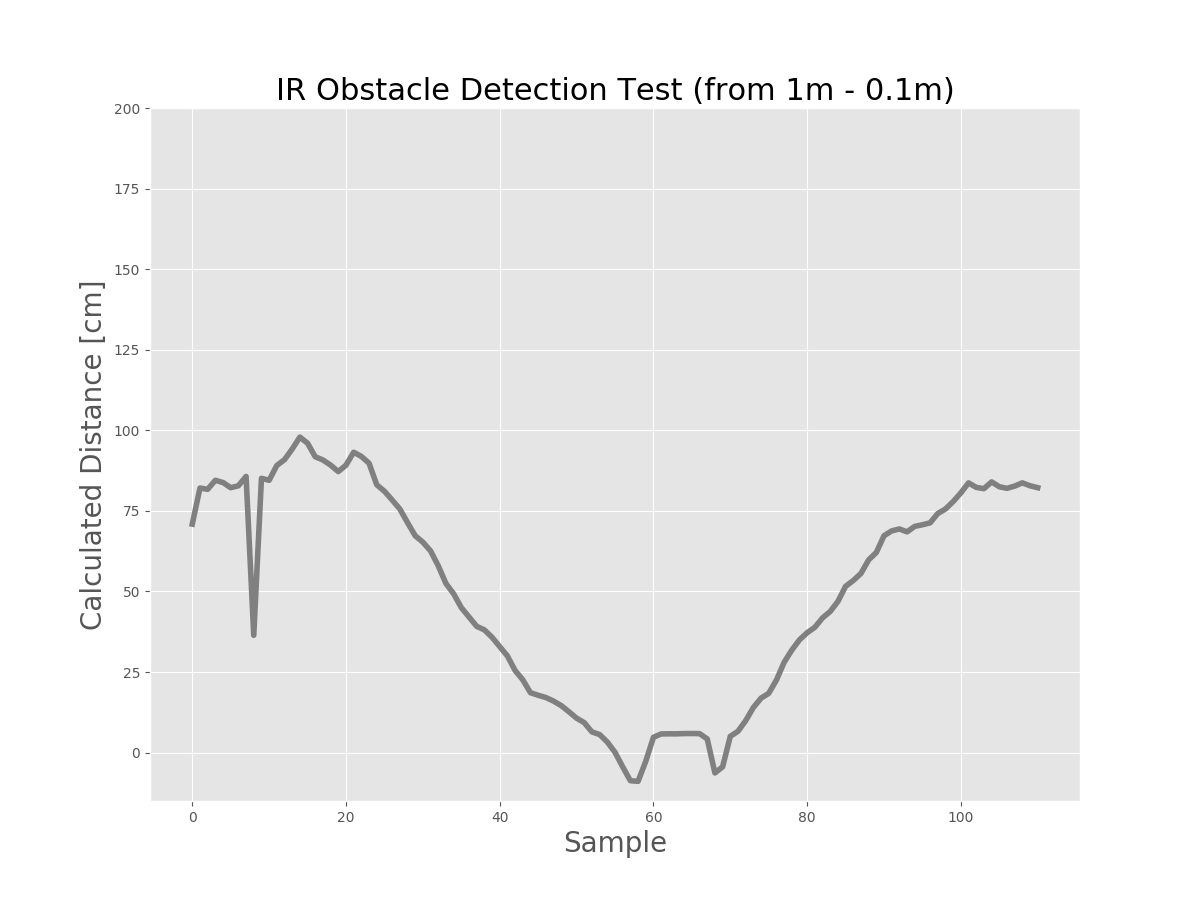
If you have been following along thus far, you should have results of your own that look similar to Figure 6 shown below. Overall, the algorithm works well for lighter surfaces (see the accuracy of Figure 6.1), but the introduction of a dark surface effects the performance of the photodiode by overestimating the distance to the object. This results in the profile shown in Figure 6.2, where the dashed line is the dark surface and the solid line is the lighter surface. You can see that the lighter surface follows the trajectory, 1m to 0.1m then back to 1m, quite well. Conversely, the dark surface over-predicts the separation distance and not until quite close to the photodiode does the approximation agree with reality. Figure 6.3 shows another image of a black surface, however, it still was not able to properly approximate the dynamics of the experiment, as compared to Figure 6.4 which shows the proper trajectory. In Figure 6.3, notice the few samples; this means that the dark surface only entered within 100 cm much closer than reality. This could cause problems in a real-world application, say if a car were approaching a dark object and the object was closer than the sensor indicates.

Conclusion
This was a particularly difficult analysis for many reasons. The first obvious issue was the omnipresent interference. The second issue was the changing accuracy with variation of material color. This was somewhat of a shock to me, since I didn't expect the emissivity to play a crucial role in the measurements. I also did not expect the sensitivity of the signal to the surrounding environment. I experienced more consistent results after blocking the off-axis geometry of each component by wrapping the sides of the TX/RX with electrical tape. Additionally, the difficulties only made the calibration and versatility of the project more difficult. Many of the results were not as expected; for example, the black surface produced much more aberrant results, except when close to the sensor. I think the main issue with this particular experiment was the low-power transmission and the poor-quality photodiode. I believe if the transmission signal was stronger (LED had more power, or more LEDs were used), then the signals would experience less attenuation over large distances. This, in addition to a better receiver (photodiode), could help this experiment be viable in obstacle avoidance technology. In another analysis, an investigation into emissivity effects on the IR signal could be helpful and help me gain insight into the true mechanisms behind the material color issues I experienced here.
Products from our Shop relevant to this project:
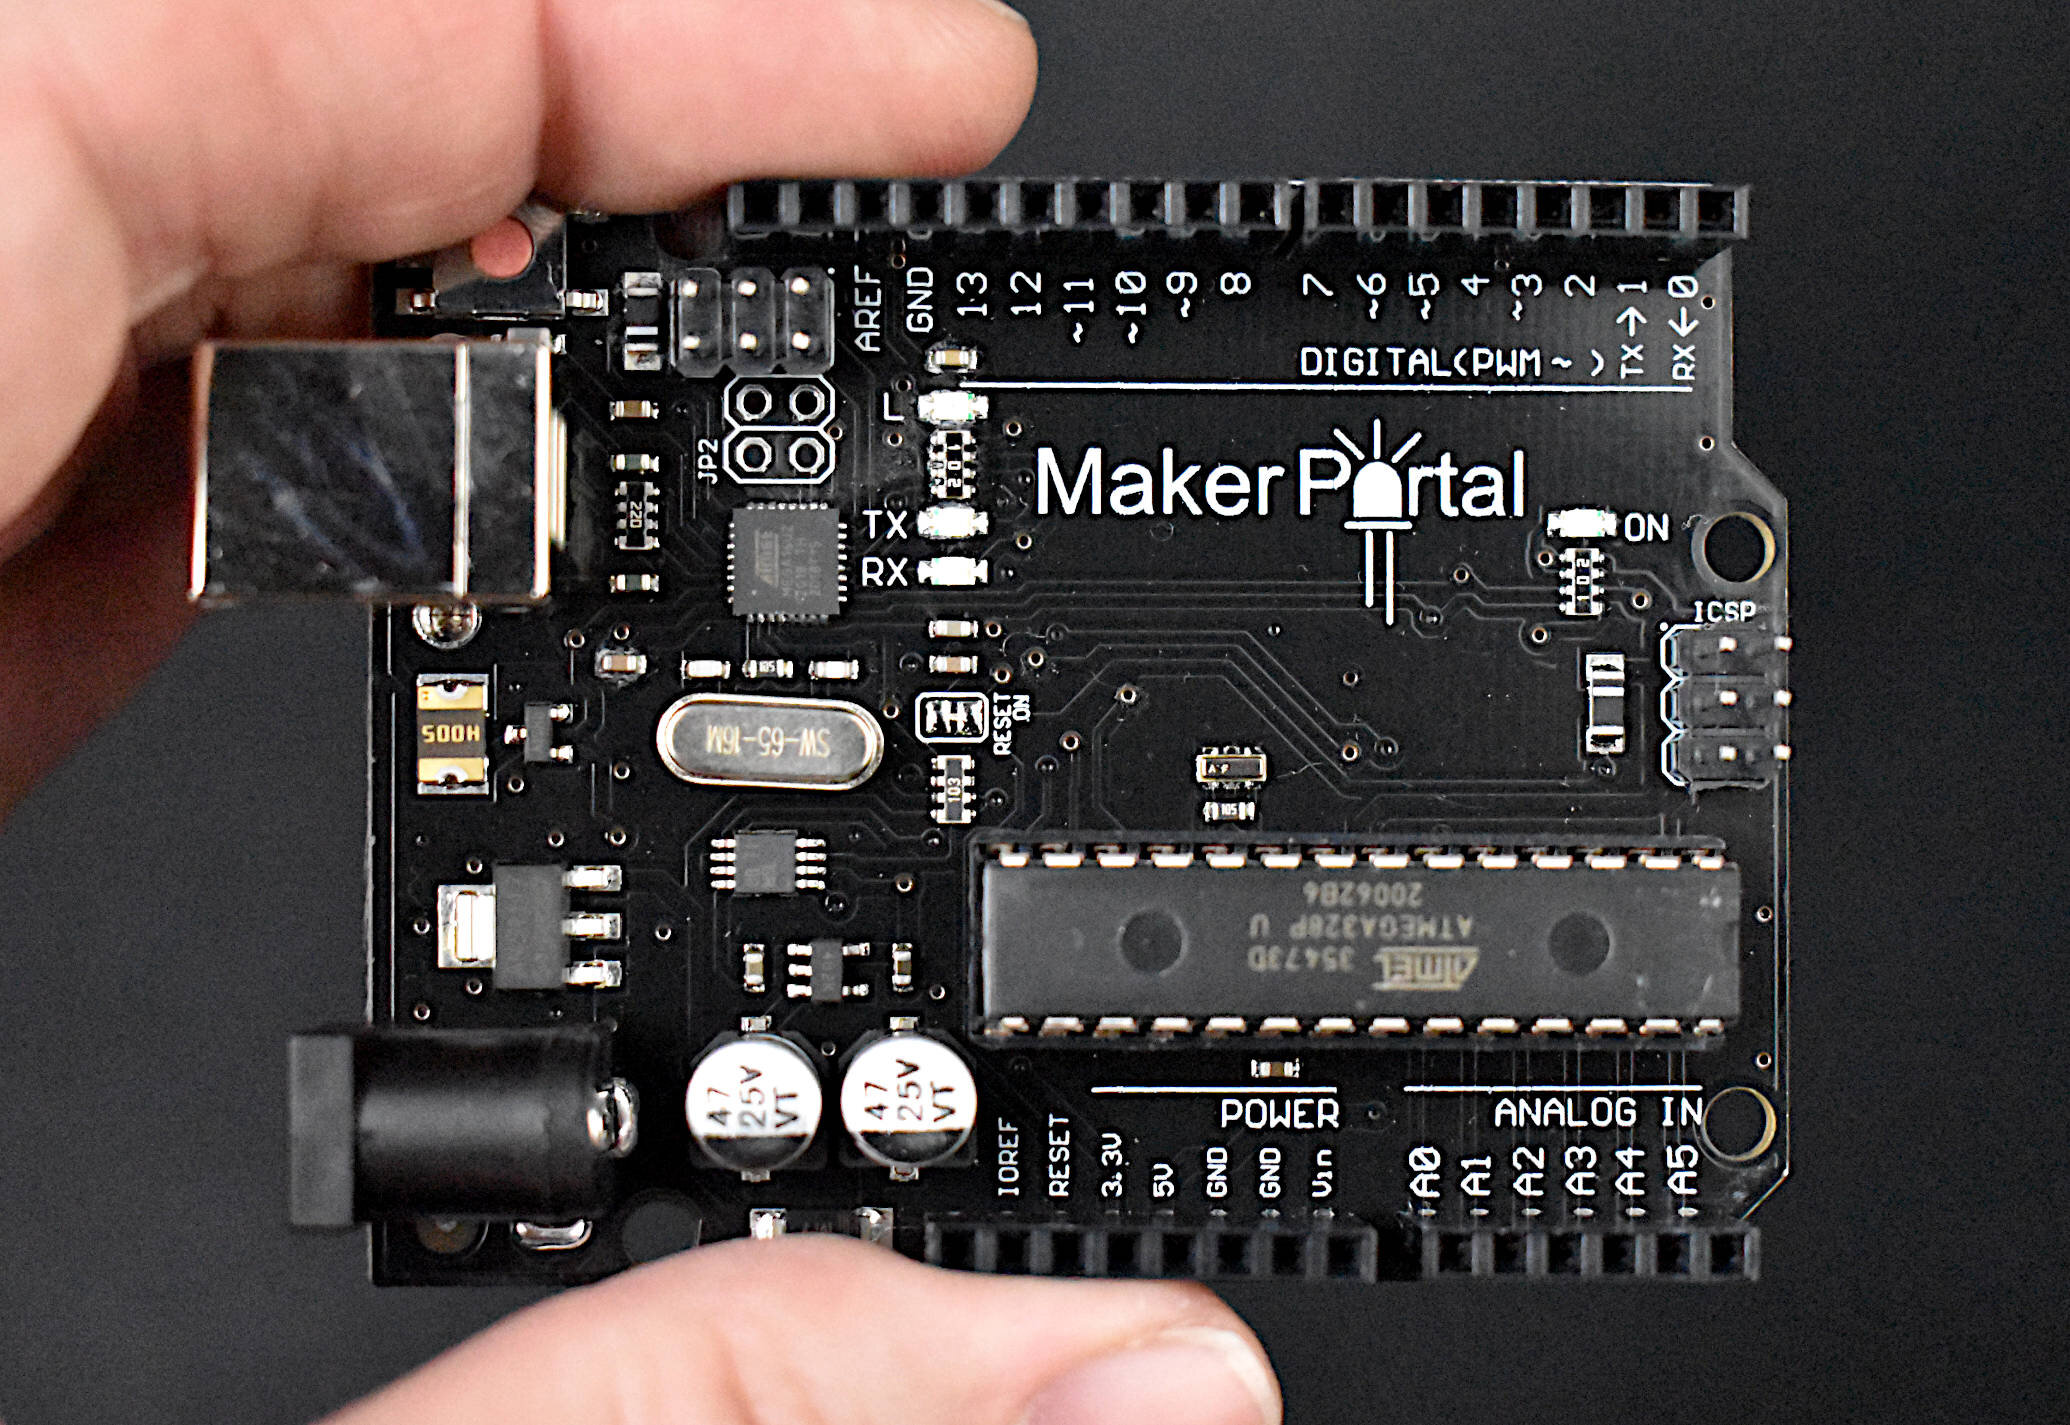
The Maker Portal Uno board is the centerpiece of many of the projects carried out in our maker spaces. The Uno board is capable of reading a wide range of sensors using analog-to-digital conversion, SPI, I2C, UART, and other common protocols. The Uno board can be used to control motors, OLED/LCD displays, and LEDs. The Arduino Uno board shown here is the official Maker Portal microcontroller, which we use in many of our projects!
Included in the Arduino Uno Package:
Maker Portal Arduino Uno Rev3 Board
Black USB Cable (1m in Length)
Specifications for Arduino Uno Rev3 Board:
ATmega328P chip with Arduino Bootloader
14 digital pins, 6 analog pins
10-bit analog-to-digital converter (ADC)
5V-12V Supply Tolerance
3.3V and 5.0V output pins
16 MHz clock
5 PWM pins, I2C support, SPI support , UART support
ATmega16U2 USB TTL, compatible with Linux, Windows, and Mac
Black Stylish Finish
Fully Integrated with Arduino IDE software

The RGB LED module allows for individual control of red, green, or blue colors all in a single module.
Included in RGB LED Module package:
1x RGB LED module
Features of RGB LED:
3.3V and 5.0V compatible
Individually addressable red, blue, and green LEDs
Arduino compatible
slim profile (4.6mm x 4.6mm RGB chip, 15mm x 24mm module dimensions)
NOTE: Our batch of these modules have reversed labels for green and red, meaning, the label R is for green, and G is for red. This was noticed after receiving and testing the modules from our manufacturer.
See More in Engineering and Arduino: