Arduino Venturi Flow Meter
“As an Amazon Associates Program member, clicking on links may result in Maker Portal receiving a small commission that helps support future projects.”
This tutorial is based, in part, on the analysis outlined in “The Design and Characterization of a 3D Printed Venturi Tube”
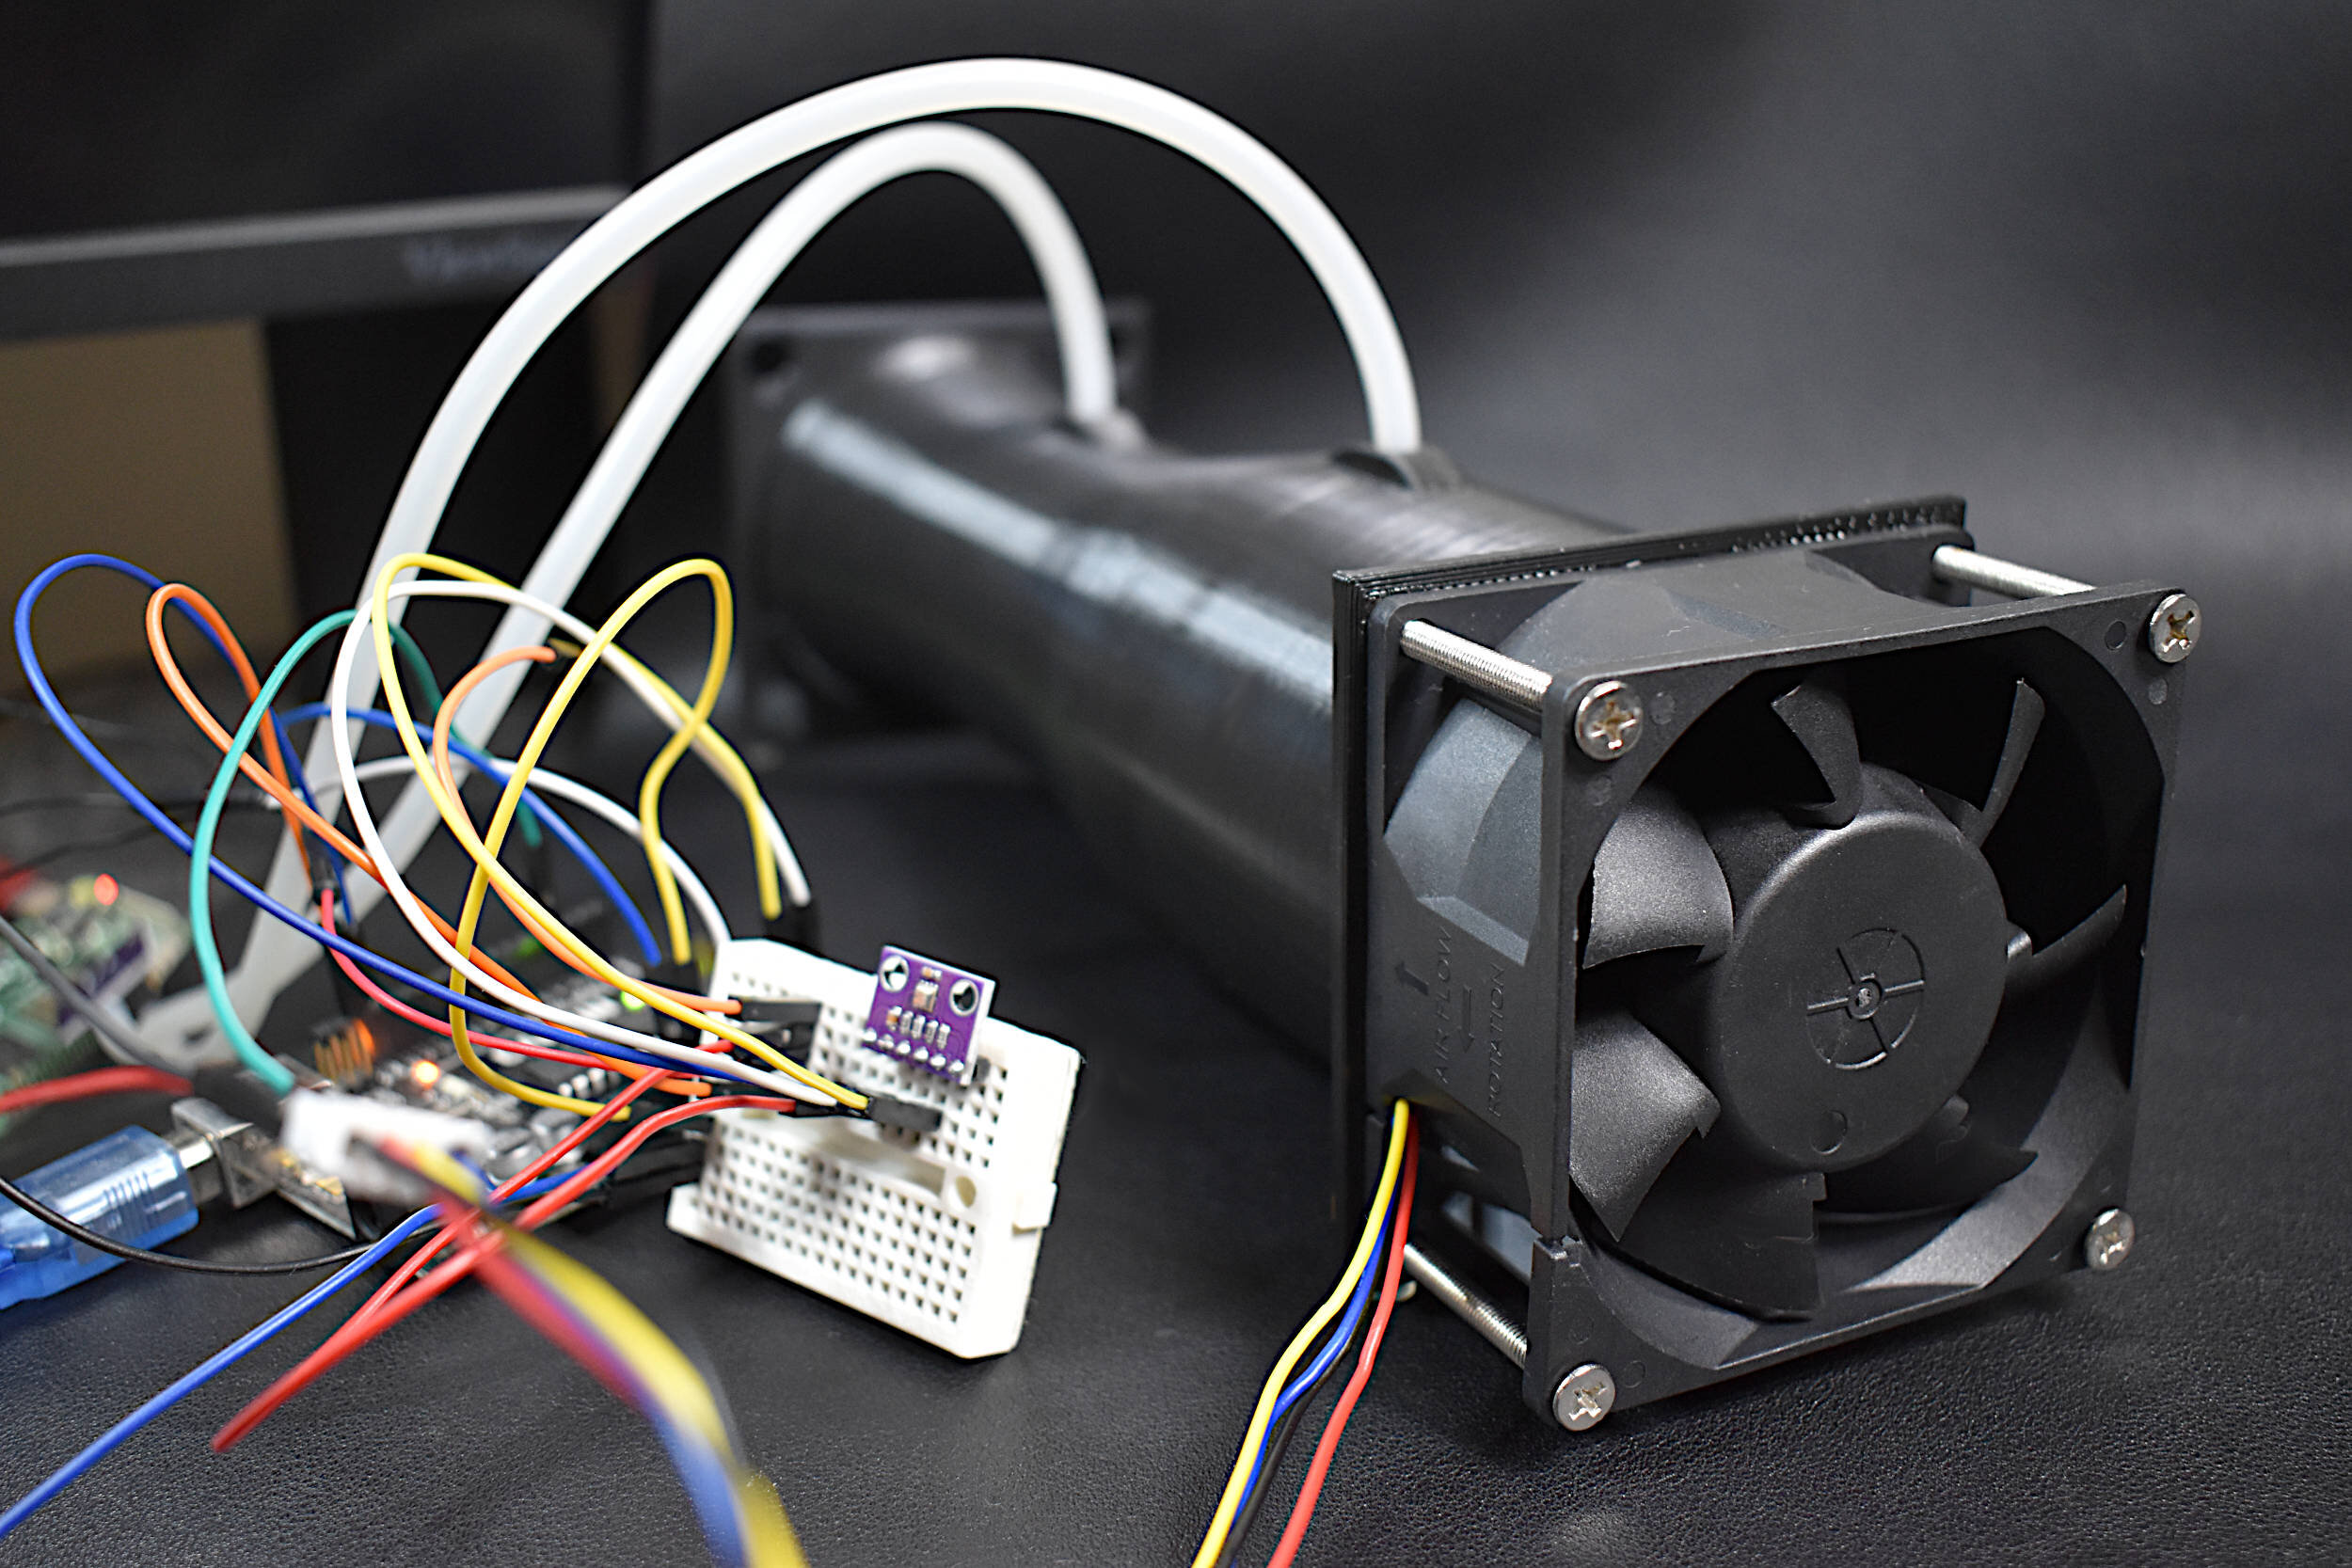
Venturi meters, sometimes referred to as venturi tubes, are flow measurement devices that take advantage of the conservation of mass and flow continuity between three separate sections within a pipe: the inlet, throat, and diffuser (outlet). Differential pressure sensors measure the pressure drop between the inlet and throat and relate it to the volumetric flow rate. The geometry of the venturi meter, along with some empirical characteristics of the flow regime, allow for very accurate quantification of flow rate. The experiment conducted here uses a 3D printed venturi meter to test an 80mm 12V DC fan across different flow rates. Pulse-width modulation (PWM) is used to control the fan's rotation speed, which creates a range of velocities through the venturi meter. The MPXV7002DP differential pressure sensor measures the pressure drop between the throat and inlet, while a BME280 measures the barometric pressure and ambient temperature.
The ASME performance test code standard on flow measurement, PTC 19.5-2004, outlines specifications for measuring fluid flow with a variety of differential pressure meters [read more about PTC 19.5-2004]. One particular measurement device, the ASME venturi tube, has been widely tested and calibrated under strict laboratory conditions, where errors can be less than 0.5% under optimal design conditions. The ASME venturi design specification is applied to the current application using fused deposition modeling—a common form of 3D printing. Commonly, steel or other hardened metals are used in the design of venturi tubes; however, for the low velocity conditions of our experiments, pressures are expected to be far below the stress limits observed for 3D printed materials.
The venturi tube introduced here is designed to fit within the limits of many common desktop 3D printers that often have vertical printing capabilities limited to 300mm or less (see popular printers by Creality, Ultimaker, Monoprice, Makerbot, Prusa). Another design constraint is the size of the fan being used at the inlet. The fan diameter will dictate the size of both the inlet and the tapered section of the venturi tube. Luckily, the perfect combination of fan size and geometry for the venturi tube were found for the 3D printing domain.
The complete background of compressible and incompressible flow through a venturi tube is not given here, but can be found in the full PDF version of the analysis. The fluid dynamics theory is introduced as it relates to ideal gas flow through the venturi tube. An Arduino board is used to both control the fan rotation speed and record data measured by a pair of sensors. The first sensor measures barometric pressure and ambient temperature, while the second measures the pressure differential across the venturi tube. The wiring of the sensors, fan, and Arduino board is also introduced in the next section. A drawing of an example venturi tube is given below:

For the experiments conducted here, the incompressible venturi equation suffices for determining velocity through the throat of the venturi meter. This allows us to start with the Bernoulli principle:
The continuity equation under incompressible assumptions can also be introduced as:
Inserting the continuity into the Bernoulli principle results in the following approximation of velocity through the venturi meter under incompressible assumptions:
where ρ is the air density, Δp is the differential pressure measured between the inlet and throat (p1-p2), and β2 is the ratio of areas, A2/A1. β can also be explained more simply as the ratio of radii, assuming the tube is cylindrical. The differential pressure will be measured by the MPXV7002DP pressure sensor, while the density will be approximated by the temperature and barometric pressure measured using the BME280 sensor.
The expression used to calculate air density is based on the ideal gas law:
Using these two equations, velocity through the venturi throat can be approximated to a fairly high degree of accuracy. Additionally, the volumetric flow rate of the DC fan can be approximated and compared with the manufacturer’s specification - which will tell us about both the accuracy of the DC fan as well as the capabilities of the venturi meter. In the next section, the parts list and wiring diagram will be introduced for the experiment.
The venturi meter introduced here is available at our store, which includes a new differential pressure sensor, the XGMP3v3, along with the 12V DC fan that is controllable via PWM signals. The XGMP3v3 was designed due to a shortage in MPXV7002DP boards during COVID-19. The functionality of the XGMP3v3 is nearly identical to the MPXV7002DP. The BME280 can also be found quite easily, resulting in the full collection of components needed to predict flow rate using the venturi meter. The full parts list is given below:
Venturi Tube Flow Meter Kit (XGMP3v3 + DC Fan + Tube)- $75.00 [Our Store]
BME280 Pressure + Temperature Sensor - [Our Store]
Arduino Uno Board - $13.00 [Our Store]
Mini Breadboard - $3.00 [Our Store]
12V Power Supply - $6.99 [Amazon]
Jumper Wires (male-to-male) - $2.25 (15pcs) [Our Store]
Raspberry Pi 4 Computer - $35.99 [Amazon], $55.00 [2GB from Our Store]

A venturi tube is a measurement device that uses the pressure differential between two sections that differ in diameter. Using Bernoulli’s principle, the velocity and flow rate can be approximated from the pressure differential measured across the two areas within the venturi tube. The venturi tube is a popular method of calculated volumetric flow rates for gases, water and oils, and other internally flowing fluids. The venturi tube given here is designed specifically for use with 80mm DC fans. The venturi tube has been used to verify fluid dynamics theory while also characterizing the relationship between duty cycle and flow rate of the fan. The fan included in this kit has been characterized to output approximately 75 cubic feet per minute (CFM). The kit also includes the XGMP3v3 differential pressure sensor (similar to the MPXV7002DP), which makes the kit a complete bundle for measuring real-world flows through a venturi tube.
See the Venturi Tube in action on Youtube.
Included in the Venturi Tube Flow Meter Kit:
1x 3D Printed Venturi Tube (236mm x 85mm x 85mm)
1x XGMP3v3 Differential Pressure Sensor (with JST-XH Connector)
1x 80mm x 38mm 12V DC Fan (+4x Screw Set)
2x Silicone Tubing (OD: 5mm, ID: 2.5mm, Length: 35cm Each)
20pcs Jumper Wires
Features of the Venturi Tube Flow Meter:
Dimensions: 236mm x 85mm x 85mm
Inlet Diameter: 76mm, Throat Diameter: 57mm
Roughness ~ 32μm
Most 80mm DC Fans Can be Affixed to Tube
Two Pressure Taps for 5mm Tubing (Inlet, Throat)
Features of the XGMP3v3 Differential Pressure Sensor:
-2.5 kPa to +2.5 kPa Measurement Range
3.3V Supply Voltage
24mA Max Power Consumption (10mW)
Analog Output Range: 0.2V - 2.7V
Measurement Accuracy: ±2.5% Full-Scale [kPa]
Temperature Compensated from 0°C - 60°C
Absolute Maximums: ±2x Pressure Max, -10°C to 85°C Operating Temperature
For Use with Non-Corrosive Gas (Air, Inert [Helium, Neon, Argon, etc.])
JST-XH Connector Makes Connection to Raspberry Pi or Arduino Simple
Features of the 12V 80mm x 38mm DC Fan:
Dimensions: 80mm x 38mm (Diameter x Thickness)
Input Voltage: 12V
Power Consumption: ~ 8.4W (12V, 0.7A)
Duty Cycle 25% - 100%
Volumetric Flow Rates: ~30CFM - 75CFM
Fairly noisy at high RPM (duty cycle 100%, 5500RPM, roughly 50dBA)
The venturi meter given in the kit above has an inner inlet diameter of 76mm and an inner throat diameter of 57mm. These values will be used later to approximate flow rate and velocity in the venturi meter.
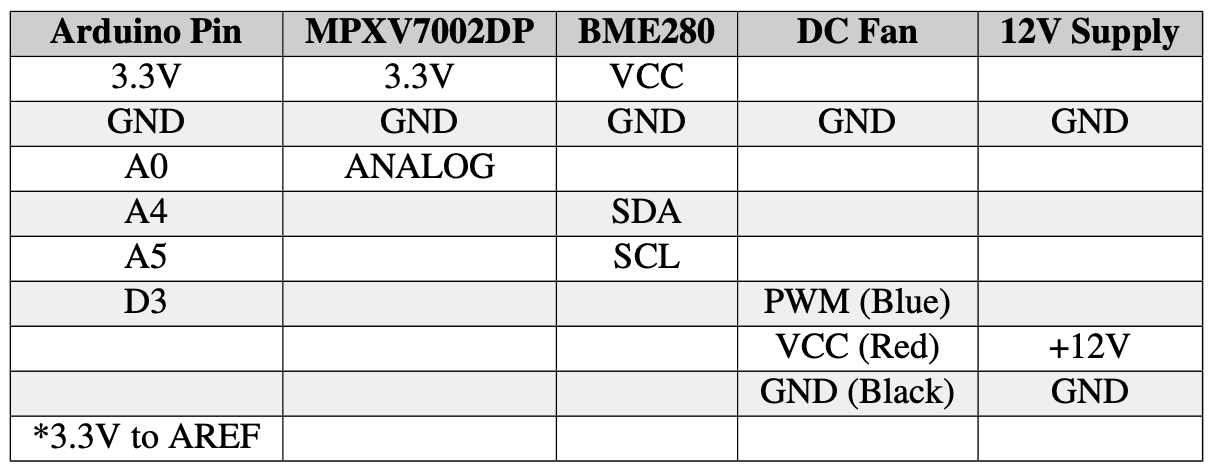
The wiring diagram for all of the components is shown below, followed by a table of pinout connections. The Arduino serves as the centroid for all connections, which is subsequently connected to a computer (Raspberry Pi in my case).

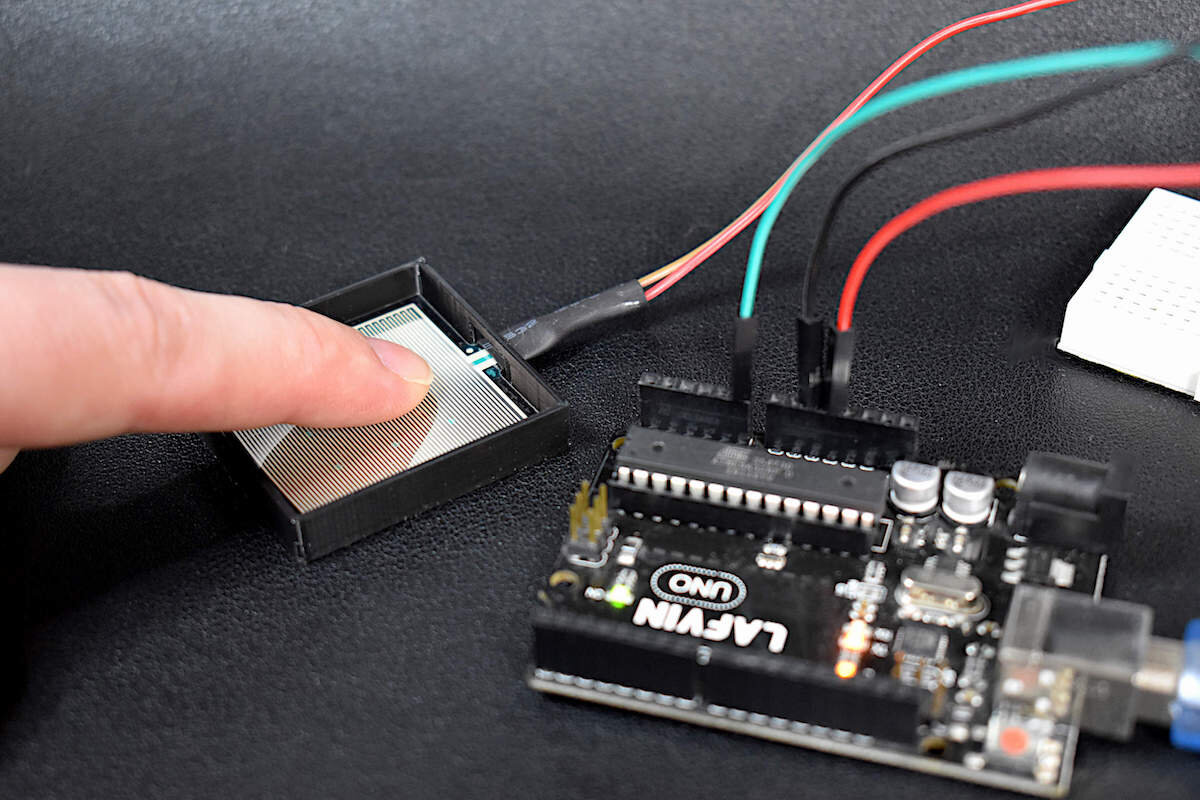
The Arduino board serves as the DC fan controller and data acquisition device for the ensuing experimentation. Arduino is particularly specialized for this application due to the platform’s integration of on-board analog-to-digital converters, complex digital protocol libraries, and the ability to use pulse-width modulation to control motors (a DC fan in our case). The open-source Arduino platform has been widely recognized as a useful educational tool for undergraduate engineering due to its simplified approach to electronics software and hardware integration. Fortunately, the sensors used to measure differential pressure, barometric pressure, and temperature have simple libraries that make the data acquisition easy and straightforward.
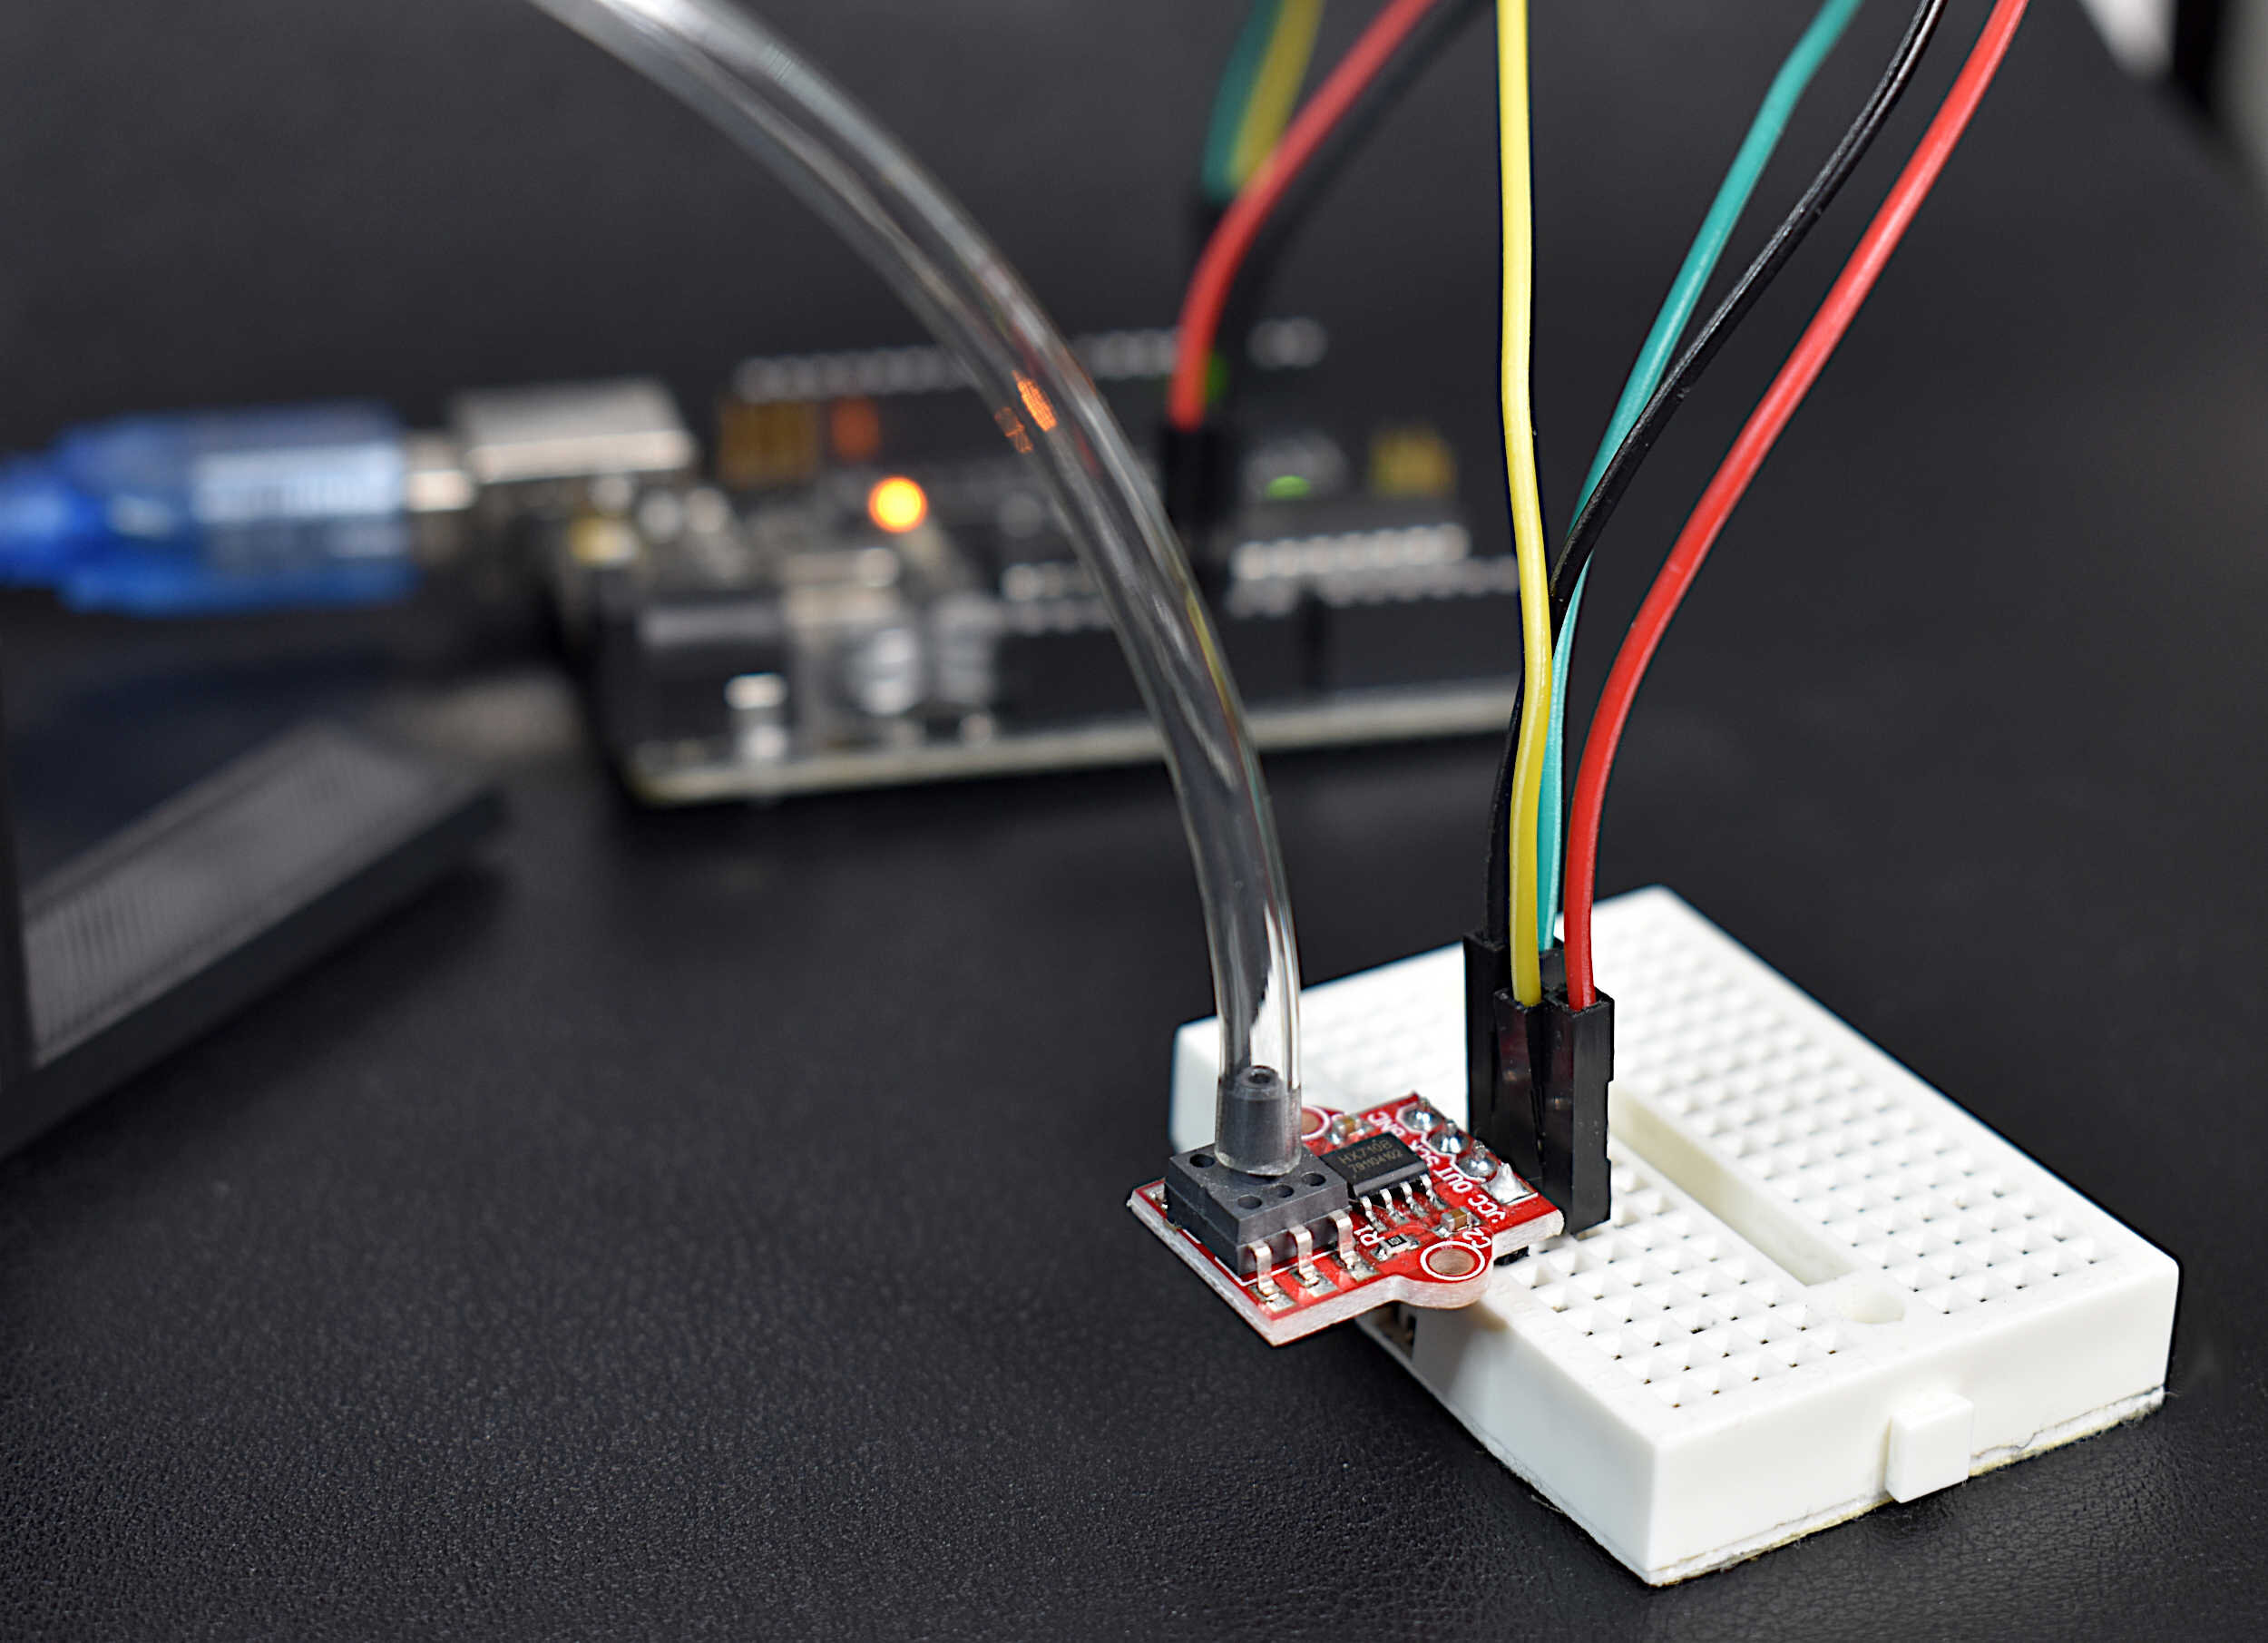
The wiring between the BME280, MPXV7002DP, DC motor, and Arduino board is given diagrammatically in the figure above and by component pins in the table. Note that the DC fan operates at 12V but shares a ground with the Arduino for PWM purposes. Pin 3 on the Arduino controls the speed of the fan using pulse-width modulation (PWM), altering the velocity through the venturi tube. The fan is an 80mm x 38mm (diameter, thickness) 12V DC, dual ball bearing fan that alters its rotation speed (RPM) according to different input duty cycles (PWM pulses). The variations in speed result in changes in pressure differential across the inlet and throat pressure taps of the meter, which is measured by the MPXV7002DP.
The pressure differential can be measured using an MPXV7002DP sensor, which converts the pressure differential between two nodes to an analog signal from -2kPa to +2kPa. The barometric pressure and standard temperature can both be acquired using a simple Arduino library that takes data from the BME280 via I2C protocol wired to the A4/A5 pins on the Arduino. The MPXV7002DP only measures the pressure differential between the inlet and tap. It is powered by the 3.3V pin on the Arduino, and its analog signal is measured by the Arduino’s first analog input pin, A0. Lastly, the barometric pressure and ambient temperature are captured by the BME280, which communicates via I2C protocol with the Arduino board on pins A4/A5. The BME280 is placed outside the venturi tube, which means that the air density will always be slightly lower than that inside the venturi tube inlet. However, the inherent error of the BME280 device (≈ 100Pa) far exceeds that of the pressure differential between the venturi inlet and atmospheric conditions. Thus, the location of the BME280 has a negligible impact on calculations, particularly in the region of low velocities presented in this study.
One important note is that the MPXV7002DP pressure nodes must be recorded properly in association with the respective venturi tube taps. This means that running a test with the meter tubing in one configuration is important for understanding how each node is connected. For example, if the pressure differential reads negative, then the nodes are reversed (assuming the fan is blowing from inlet to throat). This relates to a subtraction of the inlet node from the throat node—a higher pressure being subtracted from a low pressure. If the differential is positive, then it is in the correct configuration, i.e. the throat node is being subtracted from the inlet node.
The Arduino board is capable of 8-bit PWM output, allowing for control in intervals from 0-255, or 0%-100% in steps of 0.4%. Additionally, the Arduino has an analog-to-digital converter (ADC) with a resolution of 10-bits. When considering the MPXV7002DP, it operates between 0.33V-2.97V over a pressure range of 4kPa, giving an approximate measurement resolution of 5Pa/bit. Therefore, the Arduino is only capable of resolving pressure changes of 5Pa between the venturi inlet and throat taps.
The Arduino code used to acquire data from each sensor while also controling the duty cycle of the fan is given below:
// Pressure differential from MPXV7002DP
// with DC Fan controller via PWM, and a
// BME280 taking pressure, temp measurements
//
#include <Wire.h>
#include <Adafruit_Sensor.h>
#include <Adafruit_BME280.h>

Adafruit_BME280 bme; // I2C for BME280

// pin allocations for MPXV7002DP and fan PWM
int mpxv_pin = A0; // mpxv analog input pin
int fan_pin = 3; // PWM pin for dc fan

float V_0 = 3.3; // supply voltage to the pressure sensors

// parameters for averaging and offset
int offset = 0;
int offset_size = 10;
int mean_size = 20;
int zero_span = 2;

// dc fan pwm value
int pwm_val = 0; // PWM value for controlling fan speed
int iter_change = 0; // iterations to keep fan at specific speed
bool max_val = false; // when max PWM is reached (255), this sets it back to 0
int pwm_min = 0; // min pwm for loop
int pwm_max = 255; // max pwm for loop

// setup and calculate offset
void setup() {
  analogReference(EXTERNAL); // tell the Arduino to use 3.3V instead of 5V for analog values
  pinMode(fan_pin,OUTPUT); // setup PWM for fan

  digitalWrite(fan_pin,0); // make sure fan is off
  delay(2000);
  Serial.begin(9600); // start serial port
  delay(100);
  Serial.println("Acquisition Start"); // lets the data acquisition know you restarted
  Serial.println("PWM Value[0-255],dP[Pa],Vol. Flow Rate [CFM],Pressure [Pa],Temp. [C]"); // header
  for (int ii=0;ii<offset_size;ii++){
    offset += analogRead(mpxv_pin)-(1023/2); // offset for MPXV7002DP
  }
  offset /= offset_size;

  unsigned status;
  status = bme.begin(); // make sure BME280 was wired/is working properly
    if (!status) {
        Serial.println("No BME280 sensor available");
        while (1); // if no BME280, stay in infinite loop
    }
}

void loop() {
  float adc_avg = 0; float delta_P = 0.0; // preallocations for variables

// average a few ADC readings for stability
  for (int ii=0;ii<mean_size;ii++){
    adc_avg+= analogRead(mpxv_pin)-offset;
  }
  adc_avg/=mean_size; // average ADC value for MPXV7002DP

  // make sure if the ADC reads outside of 512+-zero_span (this increases stability around 0 pressure)
  if (adc_avg>512-zero_span and adc_avg<512+zero_span){
  } else{
    delta_P = 5000.0*((adc_avg/1023.0)-0.5); // actual differential pressure
  }
  Serial.print(pwm_val); // print PWM value
  Serial.print(","); // comma separate

  Serial.print(delta_P); // print delta P
  Serial.print(","); // comma separate

  Serial.print(bme.readPressure()); // print barometric pressure
  Serial.print(","); // comma separate

  Serial.println(bme.readTemperature()); // print temperature

  delay(100); // delay for stability

  // iterating the PWM values
  if (iter_change>50) {
    pwm_val+=10; // this can be changed to desired increase in PWM
    if (pwm_val>=pwm_max and max_val){
      pwm_val = pwm_min; // if we're at max, go to pwm_min
      max_val = false;
    }
    if (pwm_val>pwm_max and pwm_val!=pwm_max){
      pwm_val = pwm_max; // if we overshoot, go to pwm_max
      max_val = true;
    }
    iter_change = 0; // reset to get multiple points at PWM value
    analogWrite(fan_pin,pwm_val); // write the actual PWM value
  }
  iter_change+=1; // increase iter every loop
}
In the next section, the experimental procedure carried out by this code is explained, along with some caveats regarding this method.

Github Repository
The process of testing the venturi tube involves sweeping over a range of fan rotation speeds (PWM pulses, or RPM values) and collecting several data points at each of those RPM speeds. In the previous section, the Arduino code is given that loops through a range of PWM values and acquires data from each sensor. The Arduino code fully automates the process and repeats it indefinitely. Another code is used to acquire and save data in real-time from the Arduino outputs (this was done with Python in our case). The Python code is responsible for reading the PWM value, the pressure differential from the MPXV7002DP, and the barometric pressure and ambient temperature from the BME280 sensor. The Python code then exits the acquisition and saves the data upon the user pressing CTRL+C on the keyboard (the full code can be found in the PDF document of this project or on the Github project repository). Finally, the Python code plots the differential pressure and barometric pressure as a function of PWM. This allows users to see the results directly after the experiment to determine whether the tests were successful.
The general procedure of the Arduino automation code is as follows:
1. Turn the DC fan off, wait 2 seconds
2. Print out the headers to notify the data acquisition system (Python) that the experiment has started
3. Read 20 analog signals from the MPXV7002DP sensor and average them
4. Convert the MPXV7002DP signal to differential pressure
5. Print out values for PWM, MPXV7002DP pressure differential
6. Read and print values from BME280 (pressure, temperature)
7. Wait 100 milliseconds, repeat steps 3 - 6 for 20 iterations (2s)
8. Increase PWM value by 10 (4%) on fan if below maximum (255), otherwise go back to zero
9. Wait 1 second to allow fan to stabilize, repeat steps 3-8
The process loop given above will run indefinitely until the user disconnects the Arduino board. What is most straight- forward for an acquisition loop is to run the Python code, wait for the PWM pulses to span 0-255, then exit the program and unplug the Arduino board. This will give one full loop of the DC fan from off to maximum. After taking a few measurements and observing similar results over multiple runs, the data can be analyzed for quantification of the performances of the venturi tube and DC fan.

The experimentation cycle outlined above allows for the proper calibration of the venturi meter, while also testing the effect of PWM on the DC fan. A short vide of the experimental process is shown below, with the differential pressure being plotted in real time as the duty cycle of the DC fan is being increased:
In the next section, the pressure differential will be plotted, analyzed, and related back to volumetric flow rate in order to determine the efficacy of the fan in comparison with the manufacturer’s claimed flow rate.
The raw output of the differential pressure read from the MPXV7002DP should be somewhat noisy. This is shown in the video above as the duty cycle of the DC fan is increased. A raw plot of the experiment is shown below as a static example of what to expect from the differential pressure as the Arduino code advances:

Raw readout of the differential pressure measured by the MPXV7002DP using the Arduino board.
Several observations can be made upon investigation of the plot above: The DC fan does not turn on for the lower PWM signals, and stutters to get started at a certain point. The restarting of the Arduino loop can also be observed in the last few points in the figure, where the pressure has returned to zero. If we now plot differential pressure as a function of PWM signal:

Differential pressure as a function of PWM signal. The DC fan does not immediately turn on at low PWM signals, which results in zero air flow through the venturi meter. The DC fan stutters around PWM = 60 to get started, and is finally operating at 80.
The PWM signal is less interesting than the duty cycle, which is of primary interest. This lets us know the signal up time, which can be related to the average input voltage to the fan. Second, we want to use the velocity approximation to predict velocity and flow rate through the throat of the venturi meter. Using the barometric pressure, ambient temperature, and differential pressure measurements, the velocity through the throat can be approximated as follows:
The assumptions in the equation above are that temperature is given in Kelvins, diameters are given in meters, pressure Pascals, and the specific gas constant has units of J/kg-K. The coefficient in front of the velocity and area is the conversion from metric to CFM and will allow us to compare the volumetric flow rate to that of common fans and the manufacturer’s specifications.
Additionally, the PWM signal can be converted to duty cycle using the following relationship:
Finally, the flow rate for the 12V DC fan as a function of duty cycle is plotted below:

The plot above shows the average and standard deviation of the flow rate at a given duty cycle. The variability is likely due to the low resolution of the Arduino’s analog-to-digital converter (ADC). If the ADC resolution were to be 16-bit instead of the Arduino 10-bit ADC, the variability would likely be lower. It is also clear that the DC fan does not rotate at duty cycles below 20%, and perhaps the MPXV7002DP pressure sensor is unable to sense differential pressures at duty cycles between 20%-25% or the Arduino’s ADC is unable to register those changes. The maximum flow rate for the fan was found to be 75CFM at a duty cycle of 100%, which was fairly close to the manufacturer’s specification of 73CFM. This is a great indicator that both the venturi meter is working well and the DC fan is outputting as the specifications indicate.
IMPORTANT NOTE: The plot above uses a more expanded version of the venturi equation, which compensates for discharge in the venturi meter as a function of Reynolds number. See the Full PDF version of this project for more accurate predictions of flow rate.
The basics of flow measurement was introduced using a venturi meter and Arduino. The Arduino controlled the duty cycle of a 12V DC fan in order to vary the velocity flowing through the venturi meter. Two sensors, the MPXV7002DP and BME280, were used to measure differential pressure, ambient temperature, and barometric pressure. These three variables were used to then approximate the volumetric flow rate of the DC fan attached to the inlet of the venturi tube. The automated experimental process was introduced using Arduino, where the DC fan was controlled via PWM, while simultaneously acquiring the variables from the BME280 and MPXV7002DP. Using a Python code, the data was acquired from the Arduino board, which is later plotted and analyzed. The analysis of the venturi meter data demonstrated that the DC fan performed very near the cited flow rate. The conclusion is that the venturi meter is a very accurate prediction of the low velocities experienced due to the DC fan. This is clear from the range of duty cycles that related to a span of volumetric flow rates. The venturi meter introduced here has applications in prediction of fan flow rates for various control states (PWM, RPM, etc.), which can be used to accurately control electronics cooling.
See More in Engineering and Arduino: