MPS20N0040D Pressure Sensor Calibration with Arduino
“As an Amazon Associates Program member, clicking on links may result in Maker Portal receiving a small commission that helps support future projects.”
Pressure is defined as an evenly distributed force acting over a surface with a given area. The accurate measurement of pressure is essential for applications ranging from material testing to weighing scales, aircraft altitude prediction, and evaluating biological functions in humans relating to respiration and blood flow [read more about pressure measurement here]. In this tutorial, a digital pressure transducer and analog pressure manometer will be used to measure gauge pressure - where the analog manometer is used as the calibration tool for the digital pressure sensor. Arduino will be used to read the digital pressure transducer, an MPS20N0040D, and a 3D printed manometer will be used to measure analog pressure manually. The simplicity and dependability of an analog system is demonstrated, along with the ease of a digital system. Digital sensors are often calibrated with analog instruments, and the reason why becomes evident in the experiments that follow.
Pressure sensors function under a variety of different physical principles that include: fluid density and gravity, piezoelectricity, piezoresistivity, electrical capacitance, and electrical resistivity. The MPS20N0040D pressure sensor used here has very poor documentation and therefore its electrical transduction (conversion from pressure to electrical signal) is unknown. It is likely that it uses a piezoresistive element as with many other low-cost pressure transducers [see the MPR Series from Honeywell, or the MPXV700xxx sensors from NXP Semiconductors - both of which are piezoresistive]. It is not necessary to known the method through which the pressure sensor works, as long as we know the manufacturer’s sensitivity and range of the sensor.
The MPS20N0040D sensor’s datasheet consists of three pages of low-quality description and imagery that does not tell us much about the actual behavior of the sensor, nor does it give valuable information about the response curves or calibration information. For example, the datasheet claims the pressure range to be 0 - 40kPa, but also claims 5.8 psi (correct) AND 580 psi (incorrect). The datasheet continues by stating that the sensor has a voltage offset of ±25mV and a full-scale voltage output of 50mV - 100 mV. Which is it? 50mV or 100mV? And if it is both - what is the qualifier? The offset is typically associated with the zero point of the sensing range, so perhaps the range is 50mV (0mV - 50mV). The voltage range and operating pressure range are essential for interpreting a sensor’s digital response and approximating an analog pressure value. Thus, it is our duty to use analog instruments (a manometer in our case) to calibrate and compare the sensor’s actual response to the information cited in the datasheet.
The U-Tube Manometer
A manometer is a pressure measurement device that takes advantage of varying densities between liquids and gases under the influence of gravity. NIST, The National Institute of Standards and Technology, acknowledges the U-tube manometer as the primary standard for measuring pressure due to its accuracy and simplicity. A manometer often consists of an air interfacing with a liquid, often water. NIST uses air-mercury manometers as a way of avoiding some of the error associated with air-water manometers, but the applications are identical. An air-water configuration is used and discussed herein, primarily out of safety concerns [read more on manometers here].

U-Tube Manometer at Equilibrium

U-Tube Manometer at Uneven Pressures
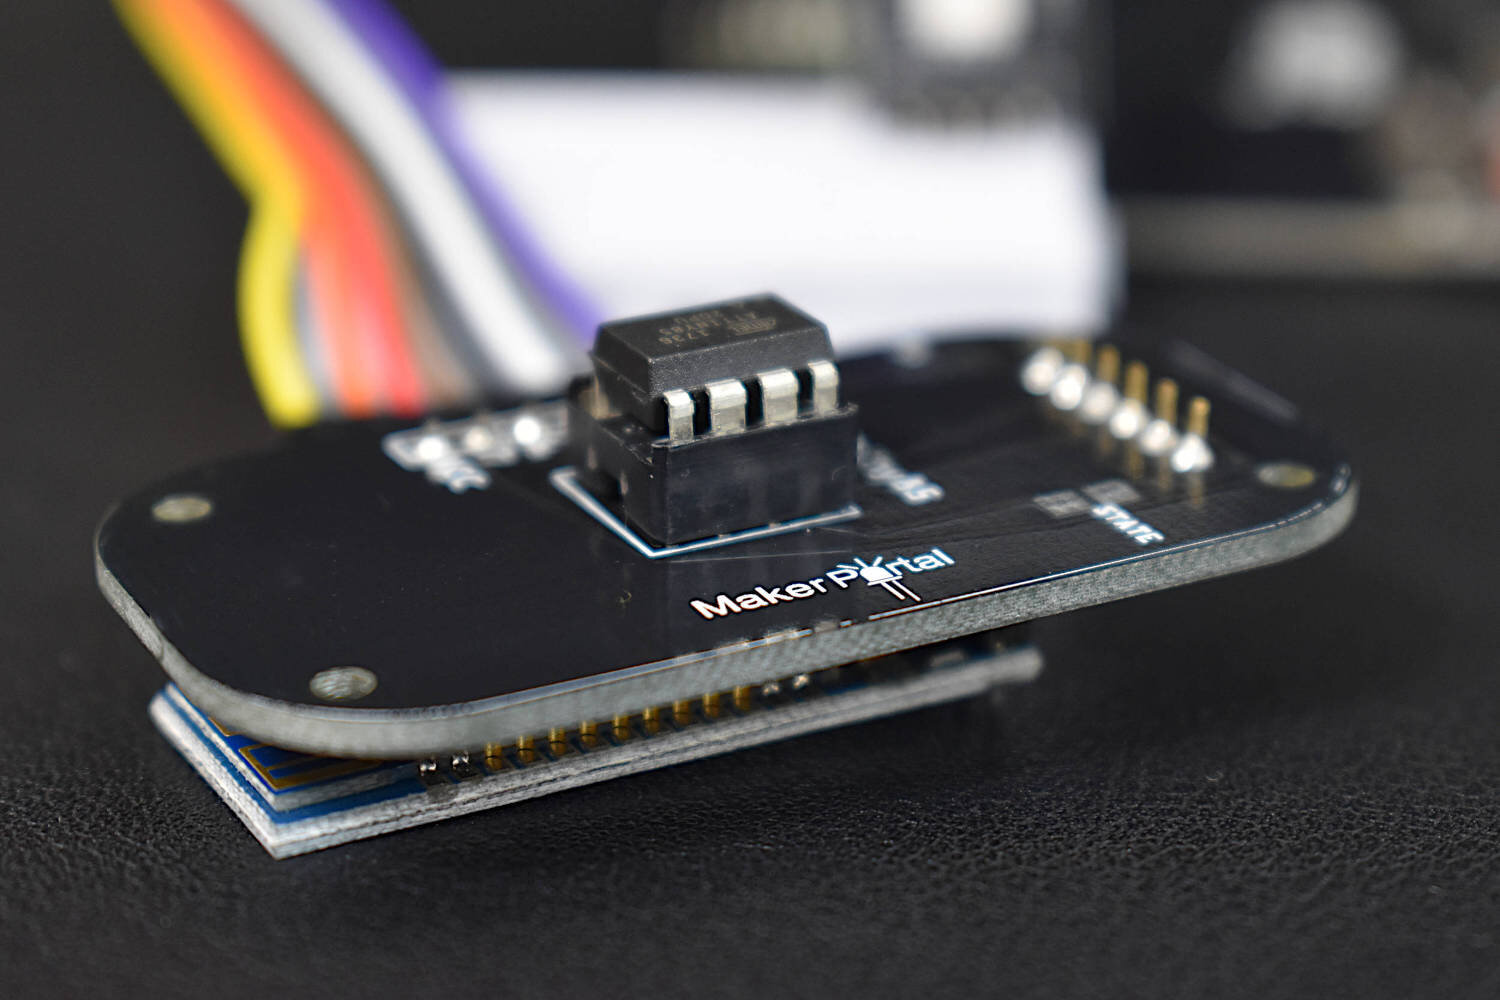
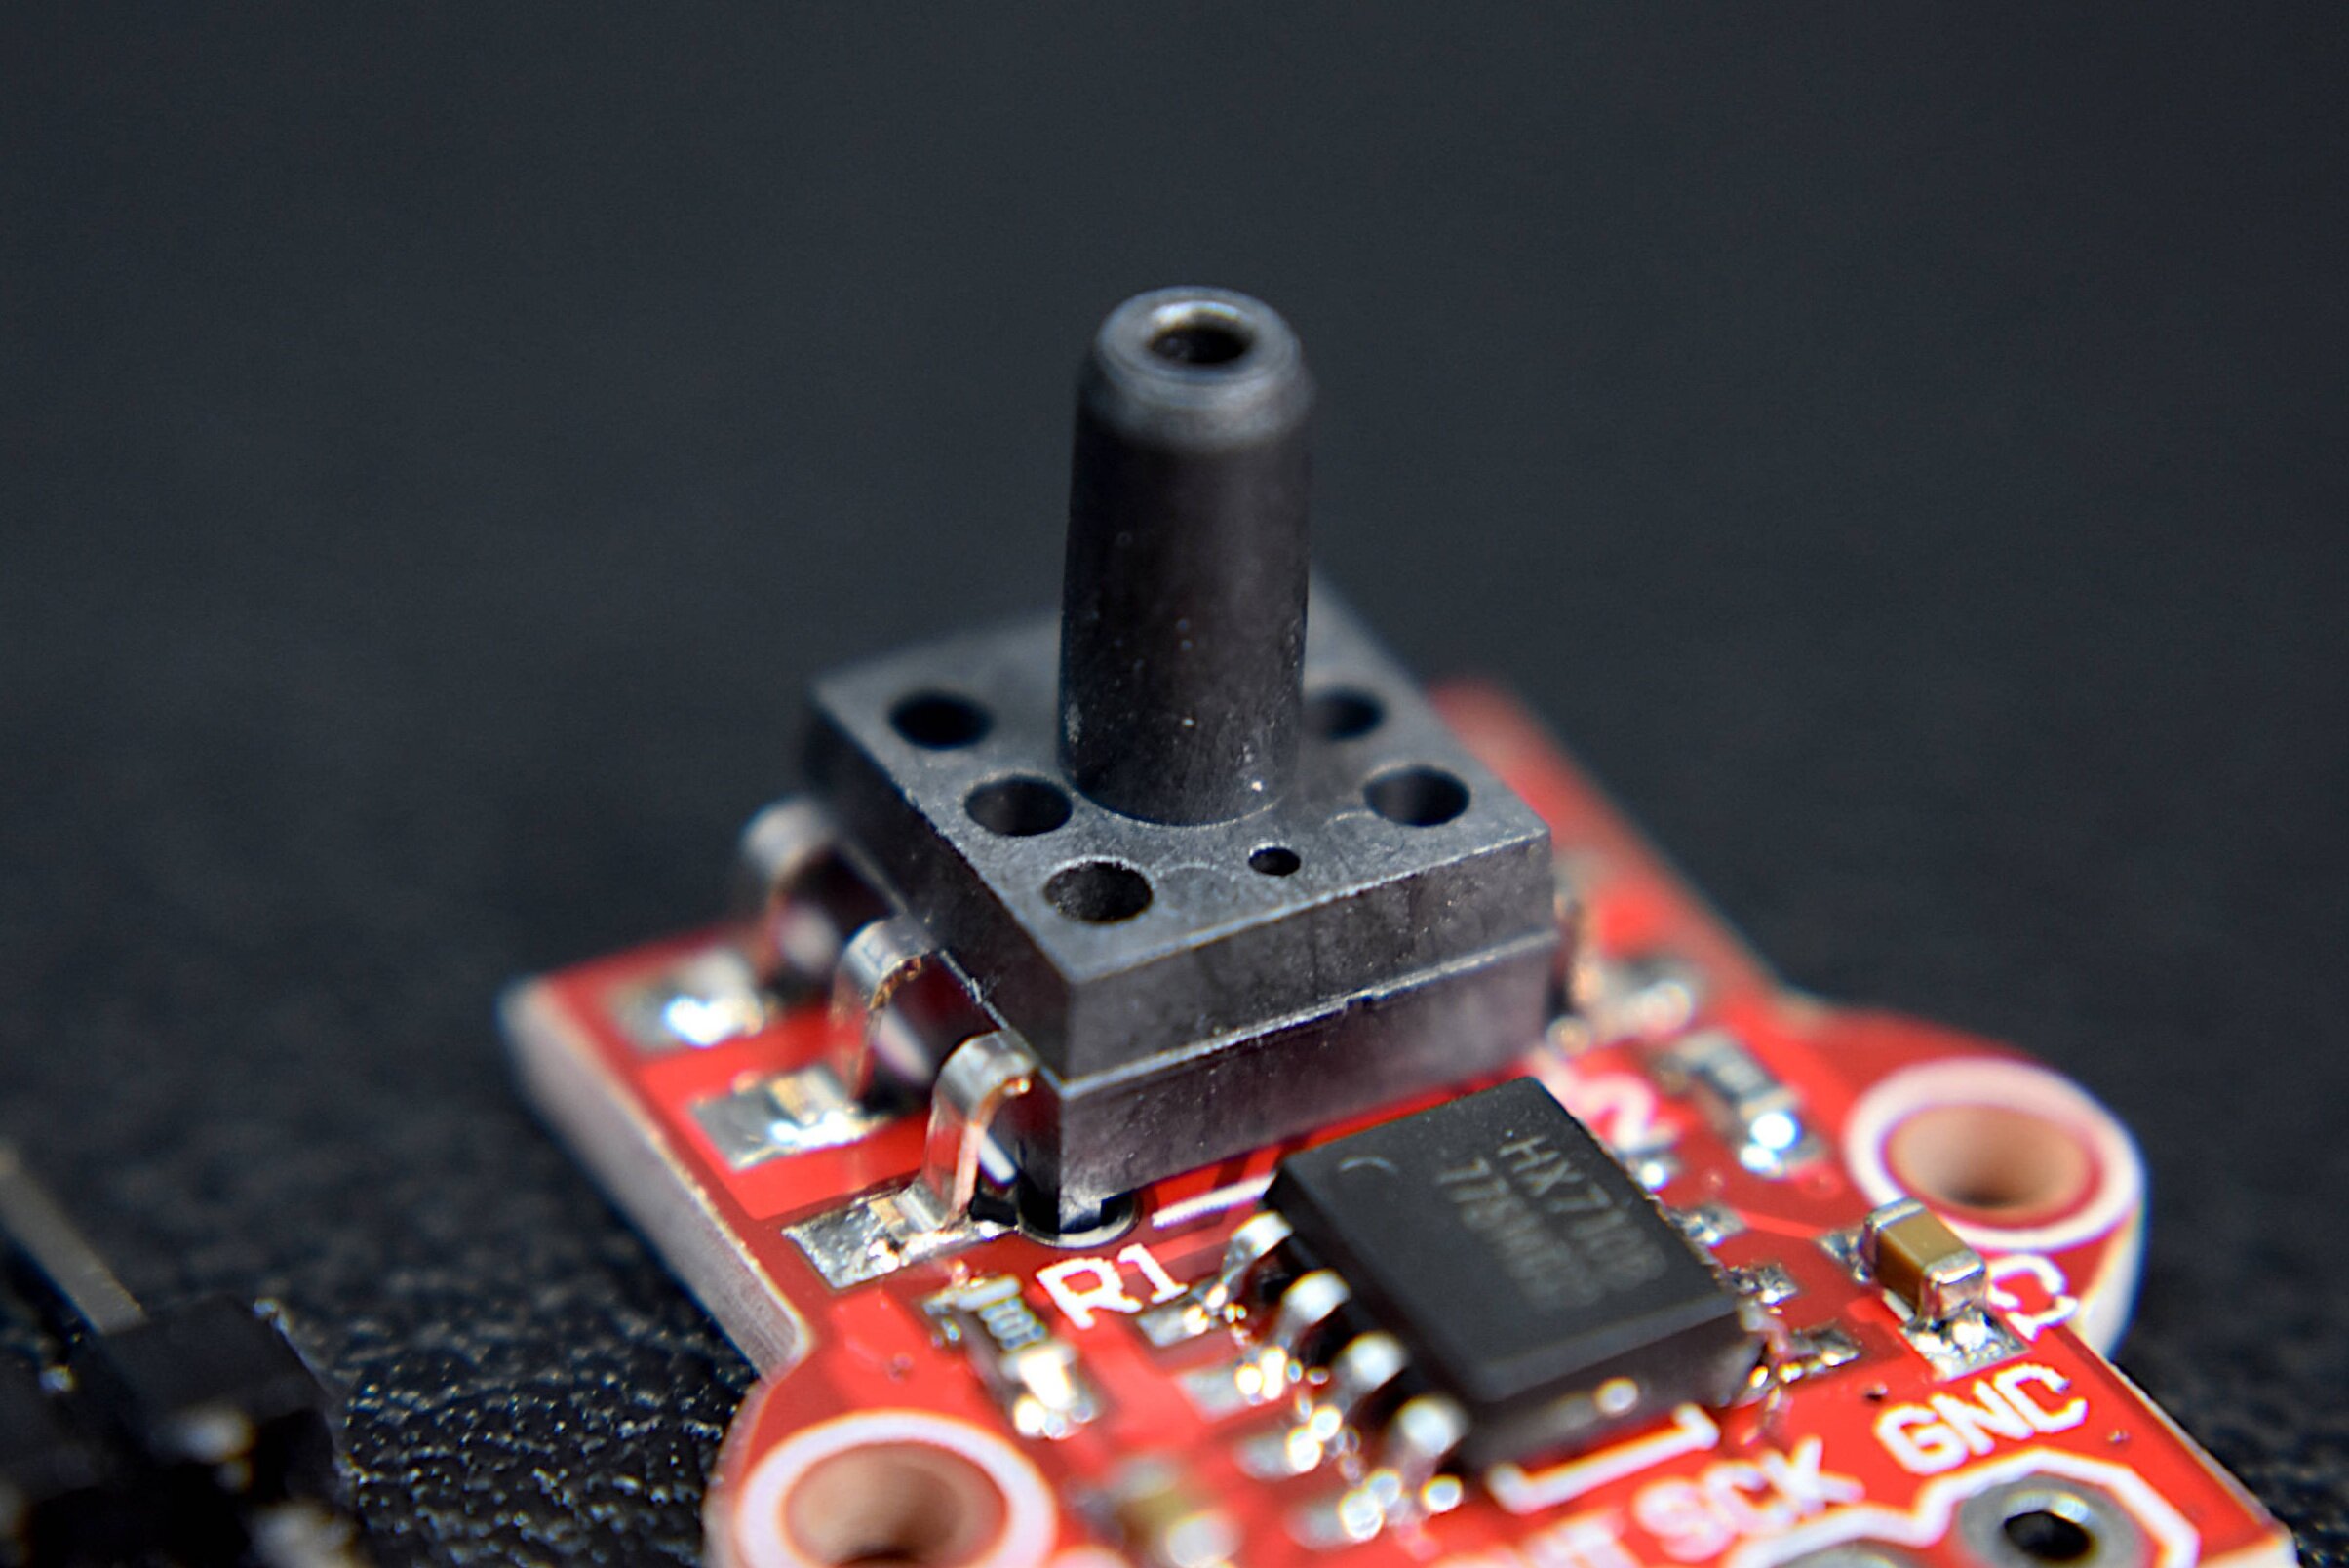
MPS20N0040D Pressure Transducer
The MPS20N0040D, as mentioned above, is a gauge pressure transducer that approximates the pressure, P, given in the last equation above. There is not much to be said about this sensor at this point, as the datasheet is awfully vague and indirect. Therefore, the assumption is that the MPS20N0040D going forward responds to 40kPa over a 50mV range. The sensor used here is attached to an Hx710B, which is a 24-bit analog-to-digital converter (ADC) and signal amplifier with a set amplification of 128. Thus, when applying 5V to the sensor, we get a possible response of 0V - 6.4V. Under the assumption of linearity (common for pressure transducers), the response of the MPS20N0040D can be approximated using a slope and intercept relationship between electrical signal and measured pressure:
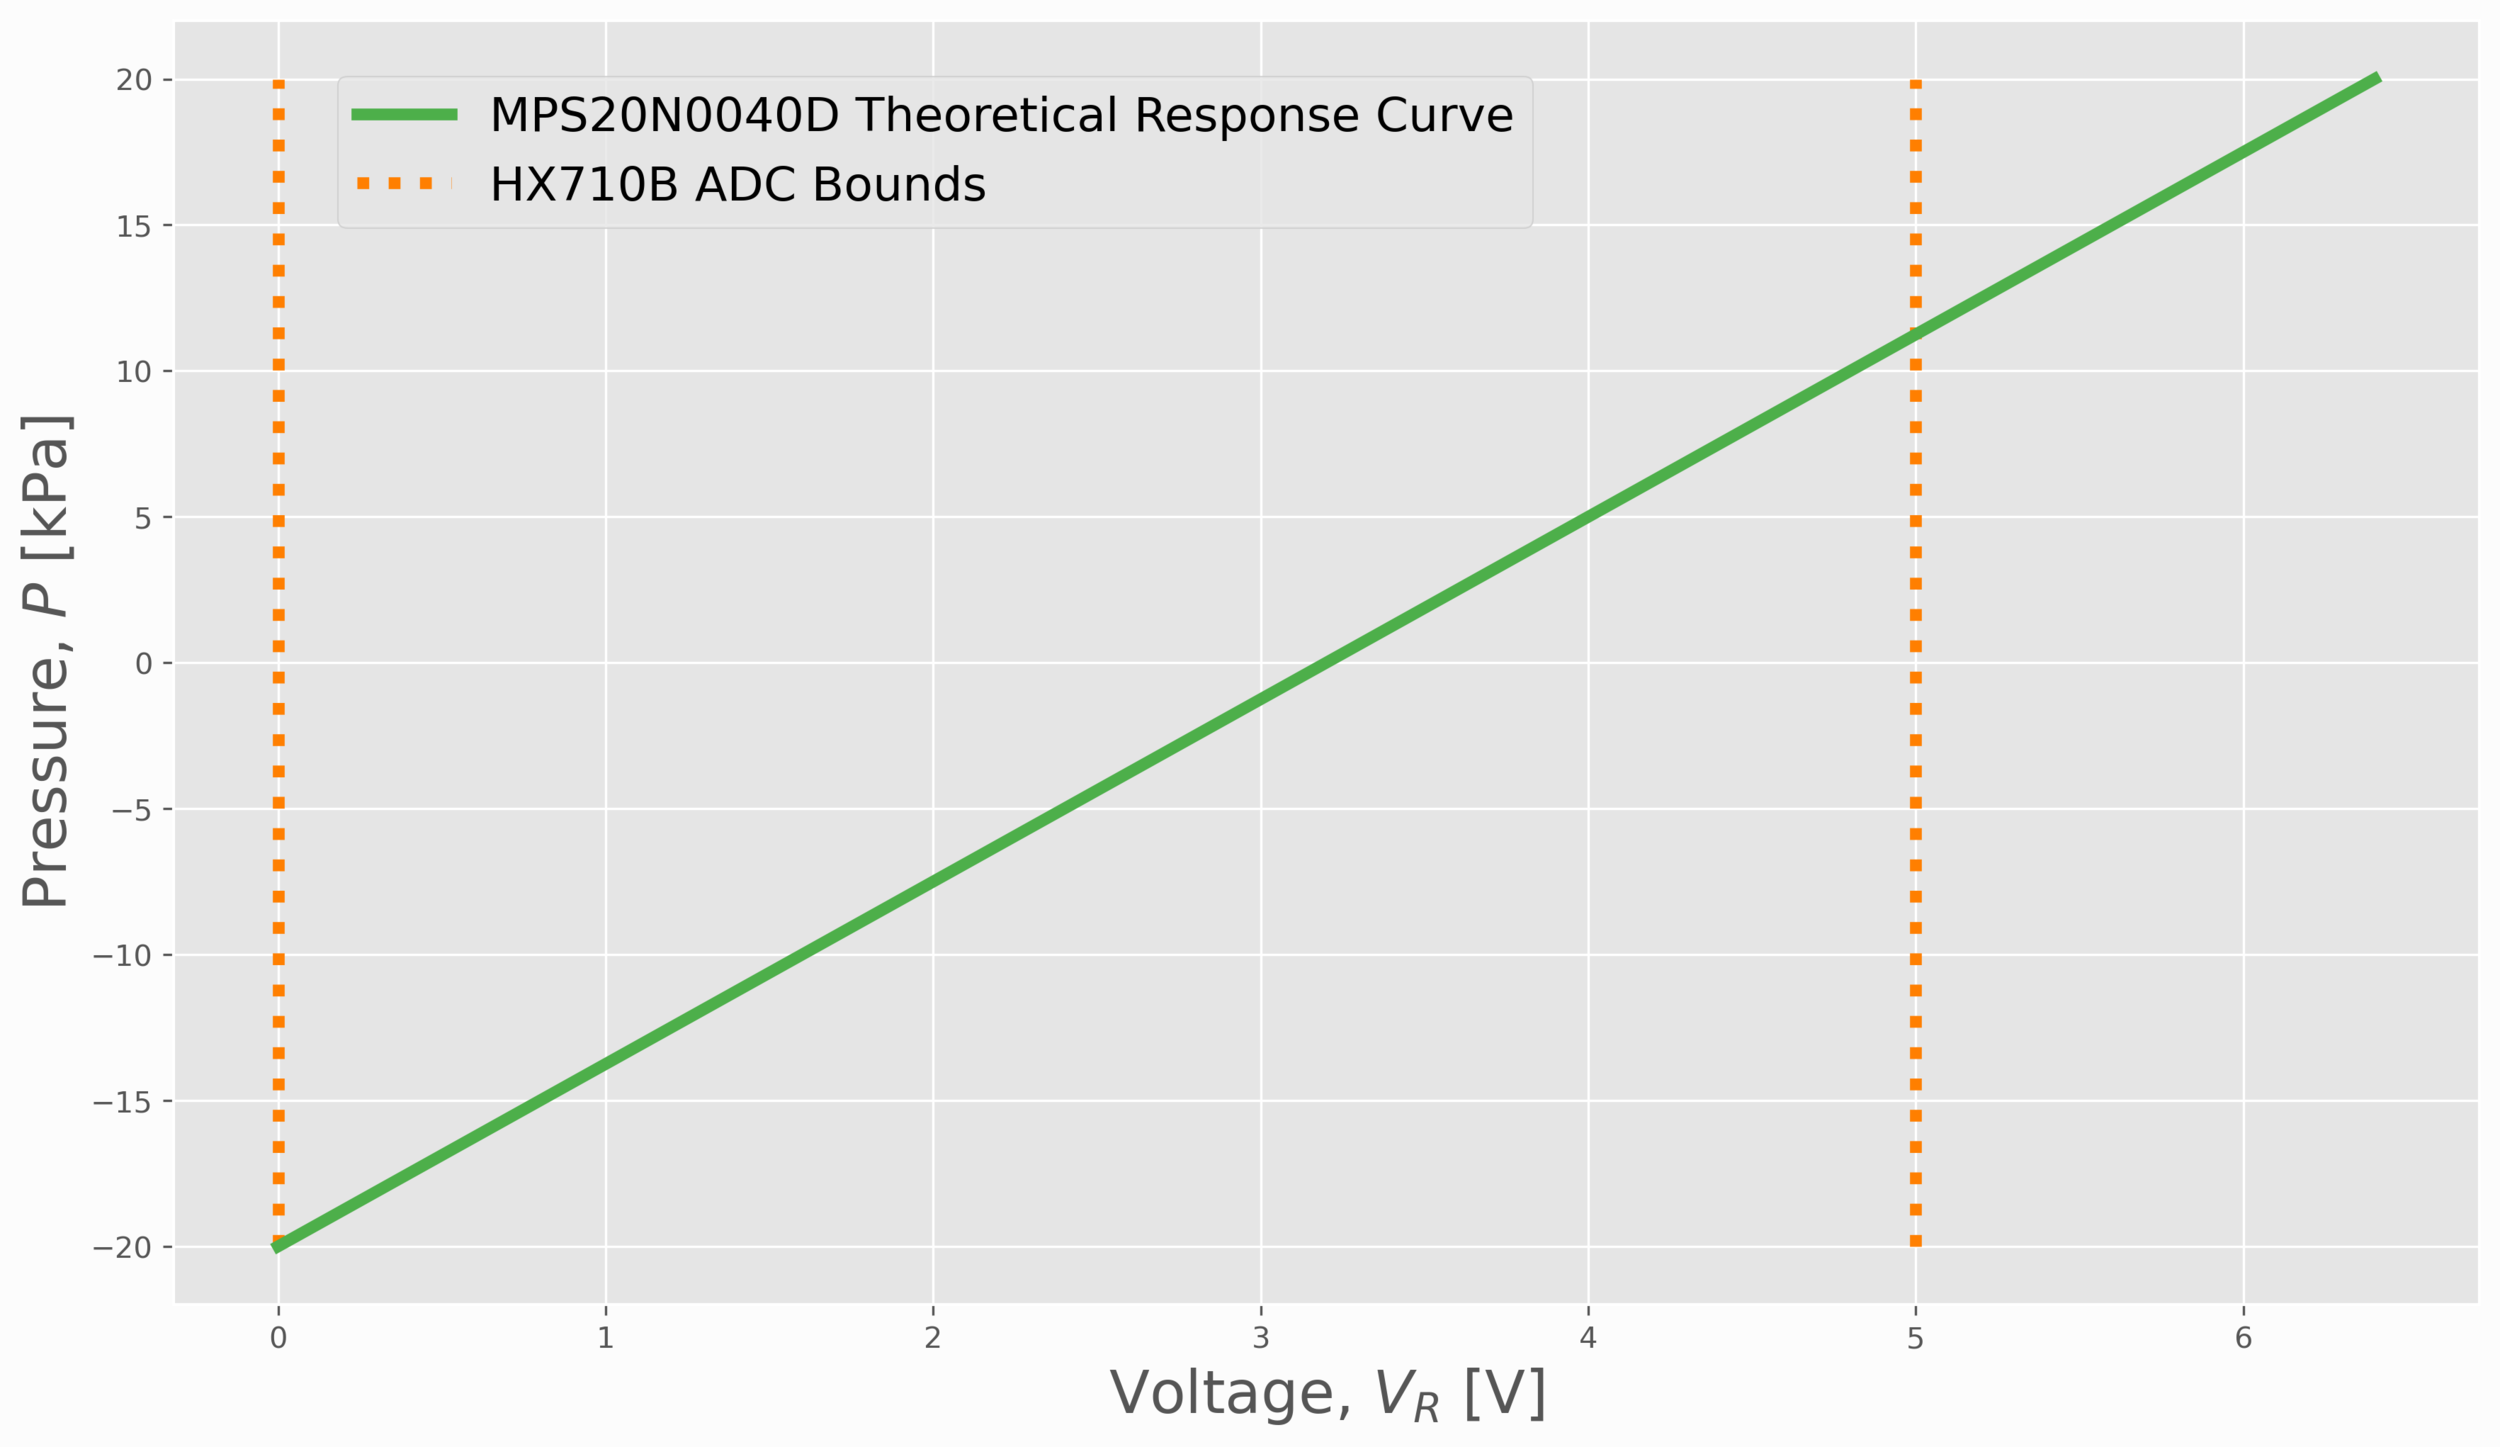
In observation of the plot above, the working range of the pressure transducer can be approximated between -20kPa and 12 kPa. This is the expected response recordable by the ADC. It is likely that this is not correct due to the very vague nature of the datasheet, however, that will be determined later in this tutorial through calibration with the analog manometer. In the next section, the wiring diagram and parts list for taking measurements with an Arduino board and manometer will be introduced.
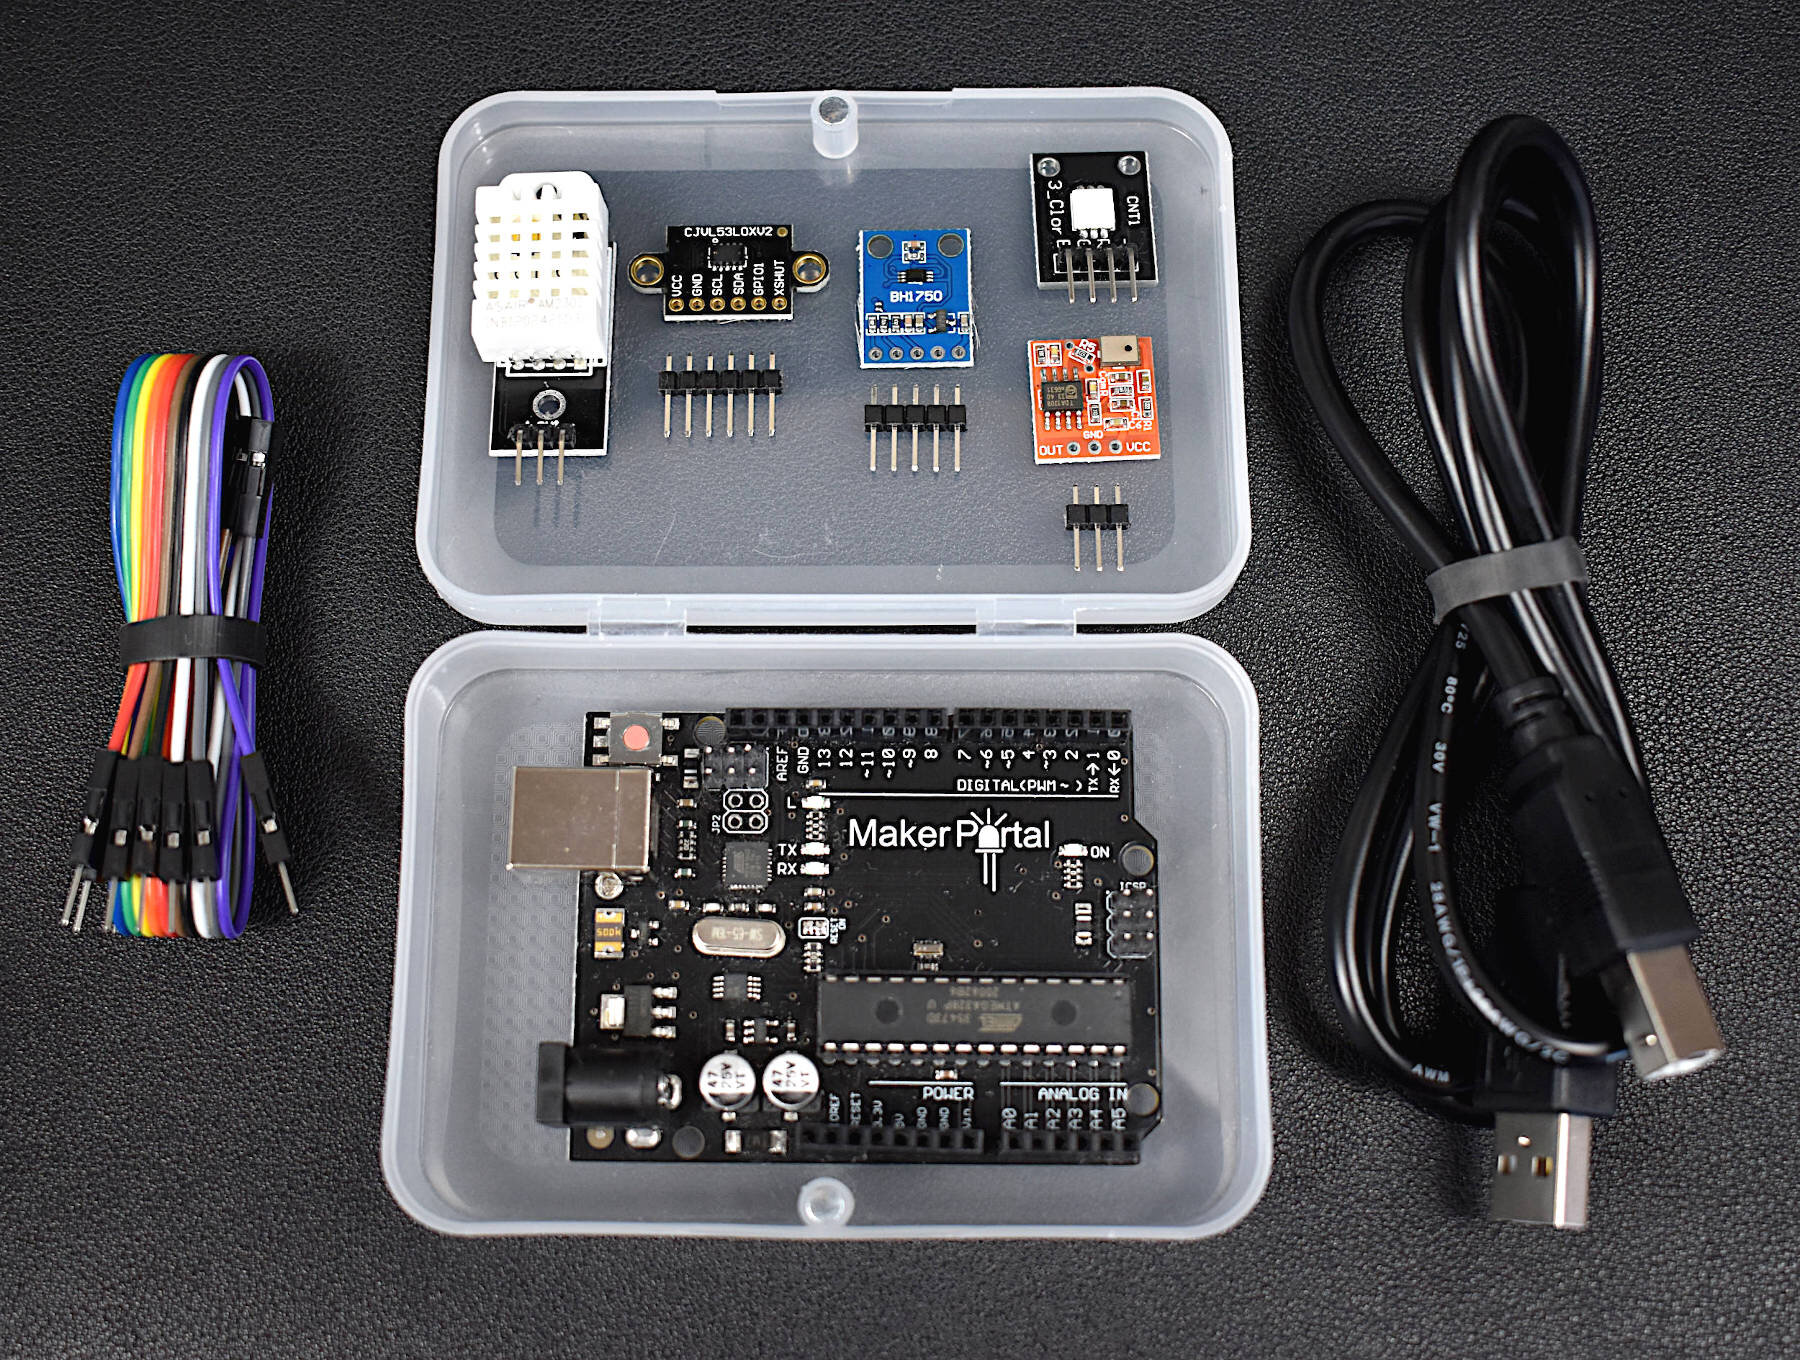
The primary components used in this experiment are the MPS20N0040D breakout board and an analog manometer. However, since air and water are used - some fittings and tubing are also required. Thus, the parts list and setup for the wiring and setup are listed below as a way to demonstrate the repeatability of this experiment:
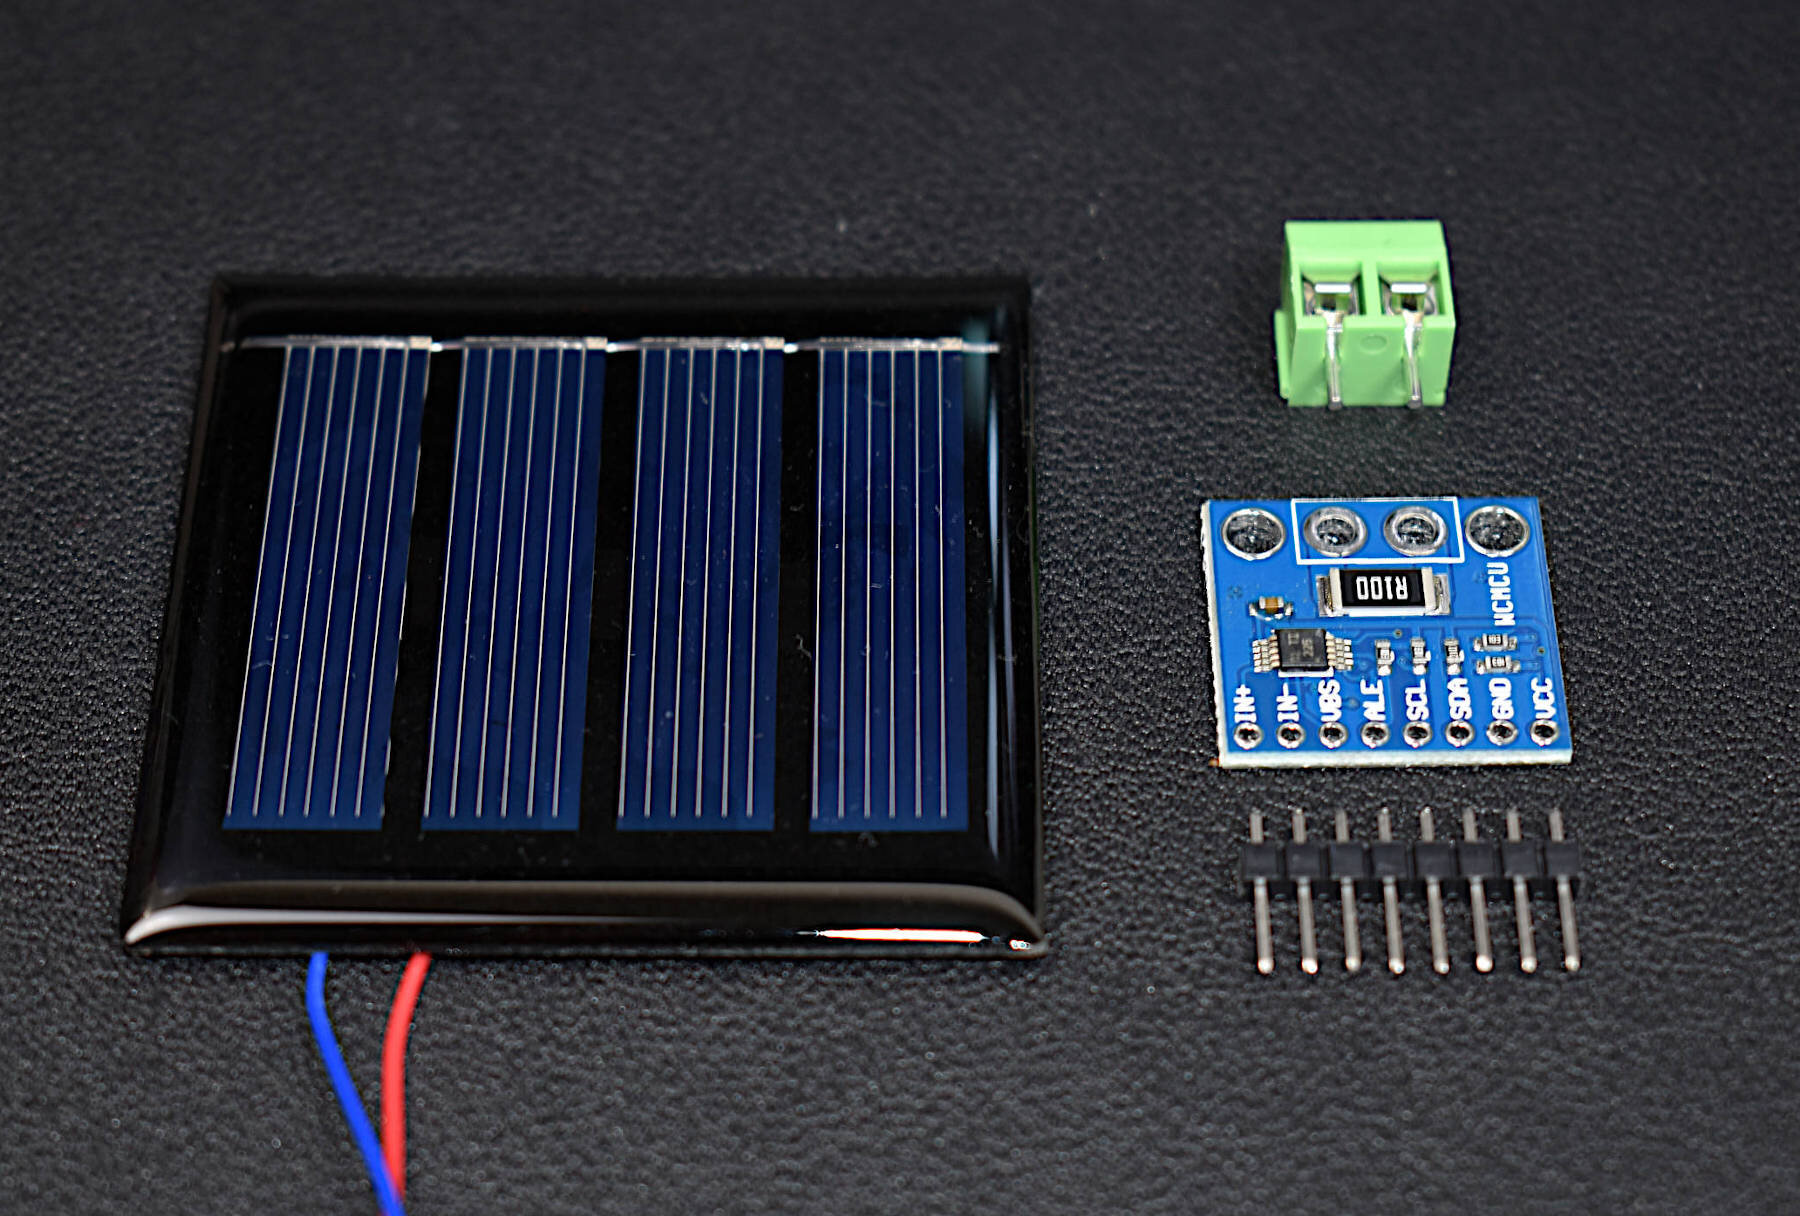
MPS20N0040D Ported Pressure Sensor Breakout Board - $9.00 [Our Store]
Analog U-Tube Manometer - $30.00 [Our Store], $12.00 [Amazon]
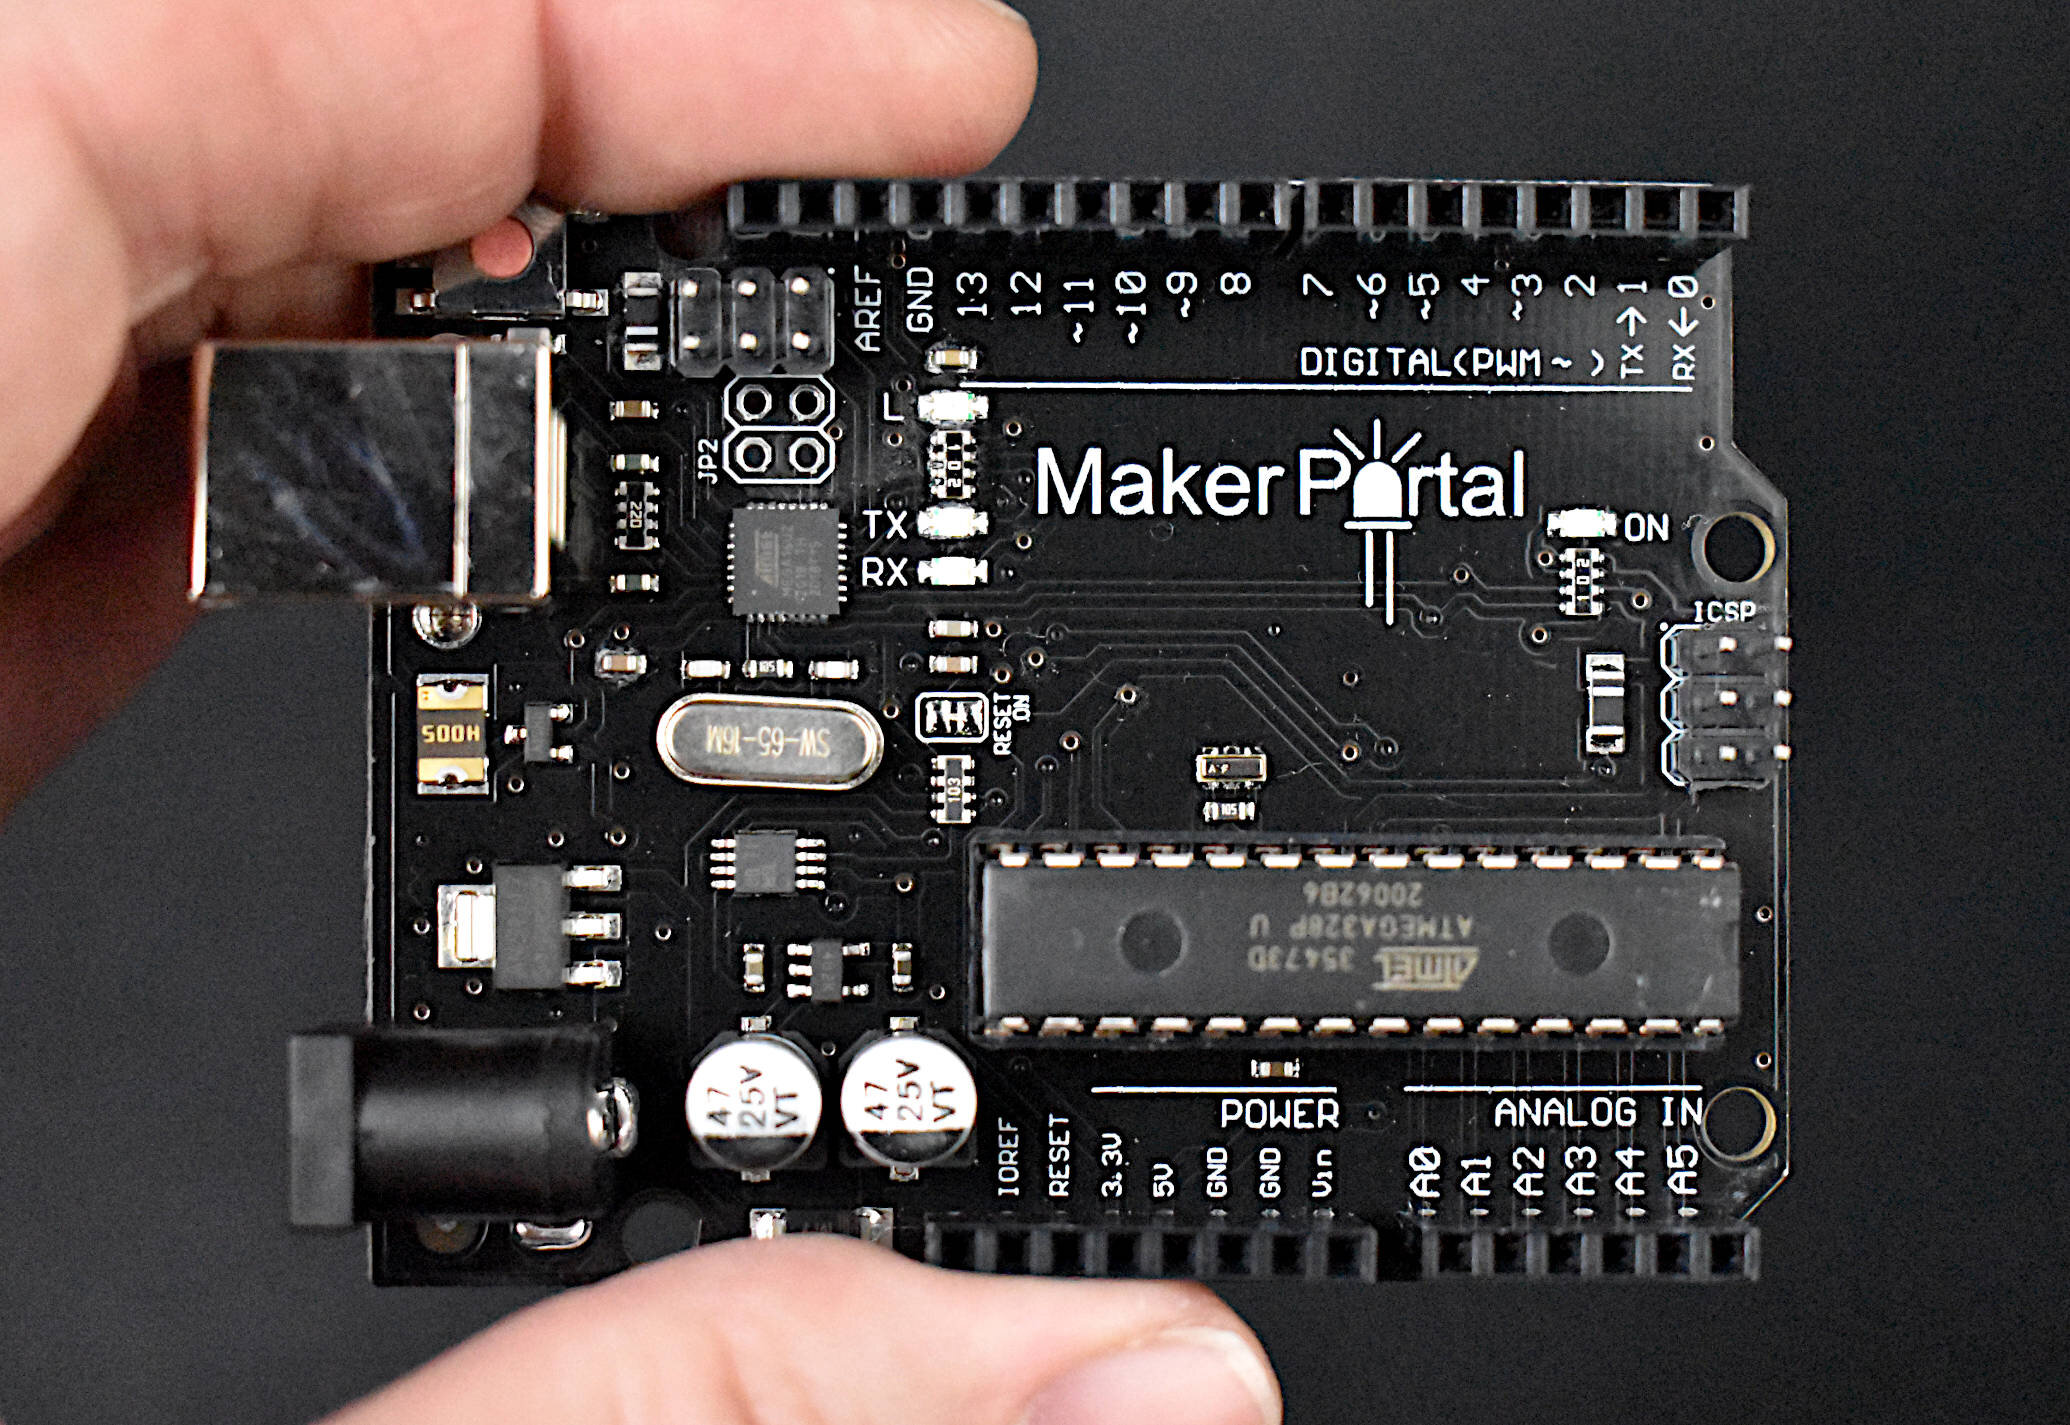
Arduino Uno Board - $13.00 [Our Store]
2.5mm (ID) x 4mm (OD) Acrylic Tubing - $12.99 (10m) [Amazon]
4mm Tee Fitting - $9.99 (10 pcs) [Amazon]
Mini Breadboard - $3.00 [Our Store]
4x Jumper Wires - $0.60 [Our Store]
Digital Caliper (6-inch) - $20.60 [Amazon]
4mm Push Valve - $7.98 [Amazon]
Multiple Syringe Kit for 2.5mm ID Tube - $6.98 [Amazon]
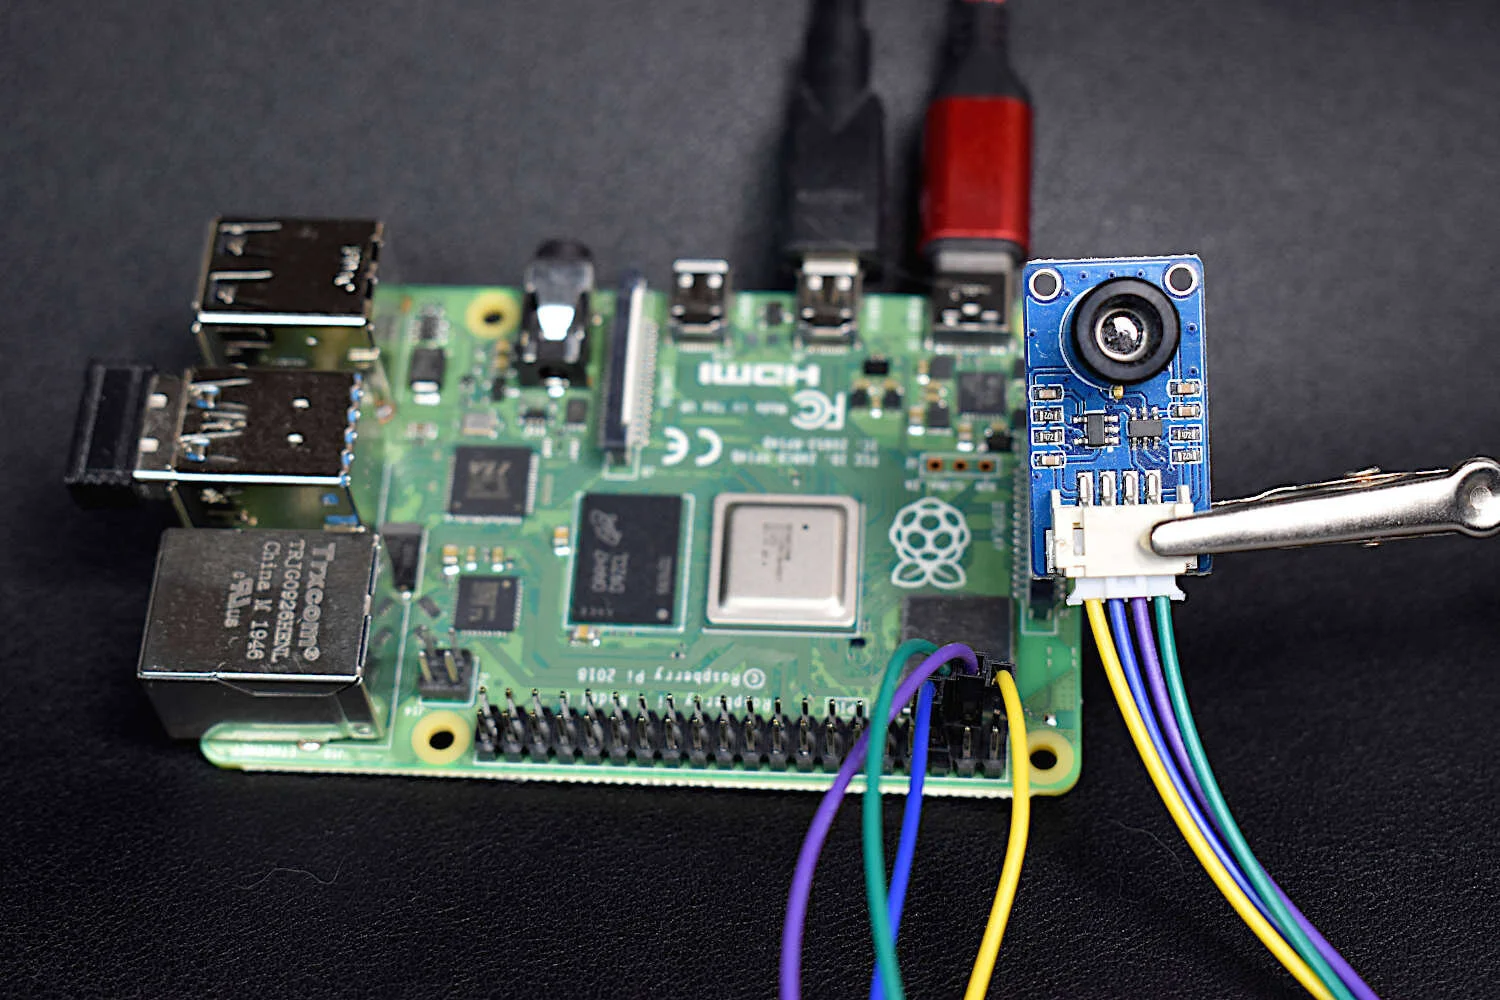
Raspberry Pi 4 Computer - $55.00 [2GB from Our Store]
Also consider purchasing our pressure transducer calibration kit, which includes the MPS20N0040D, manometer, and 2.5mm ID (4mm OD) tubing:
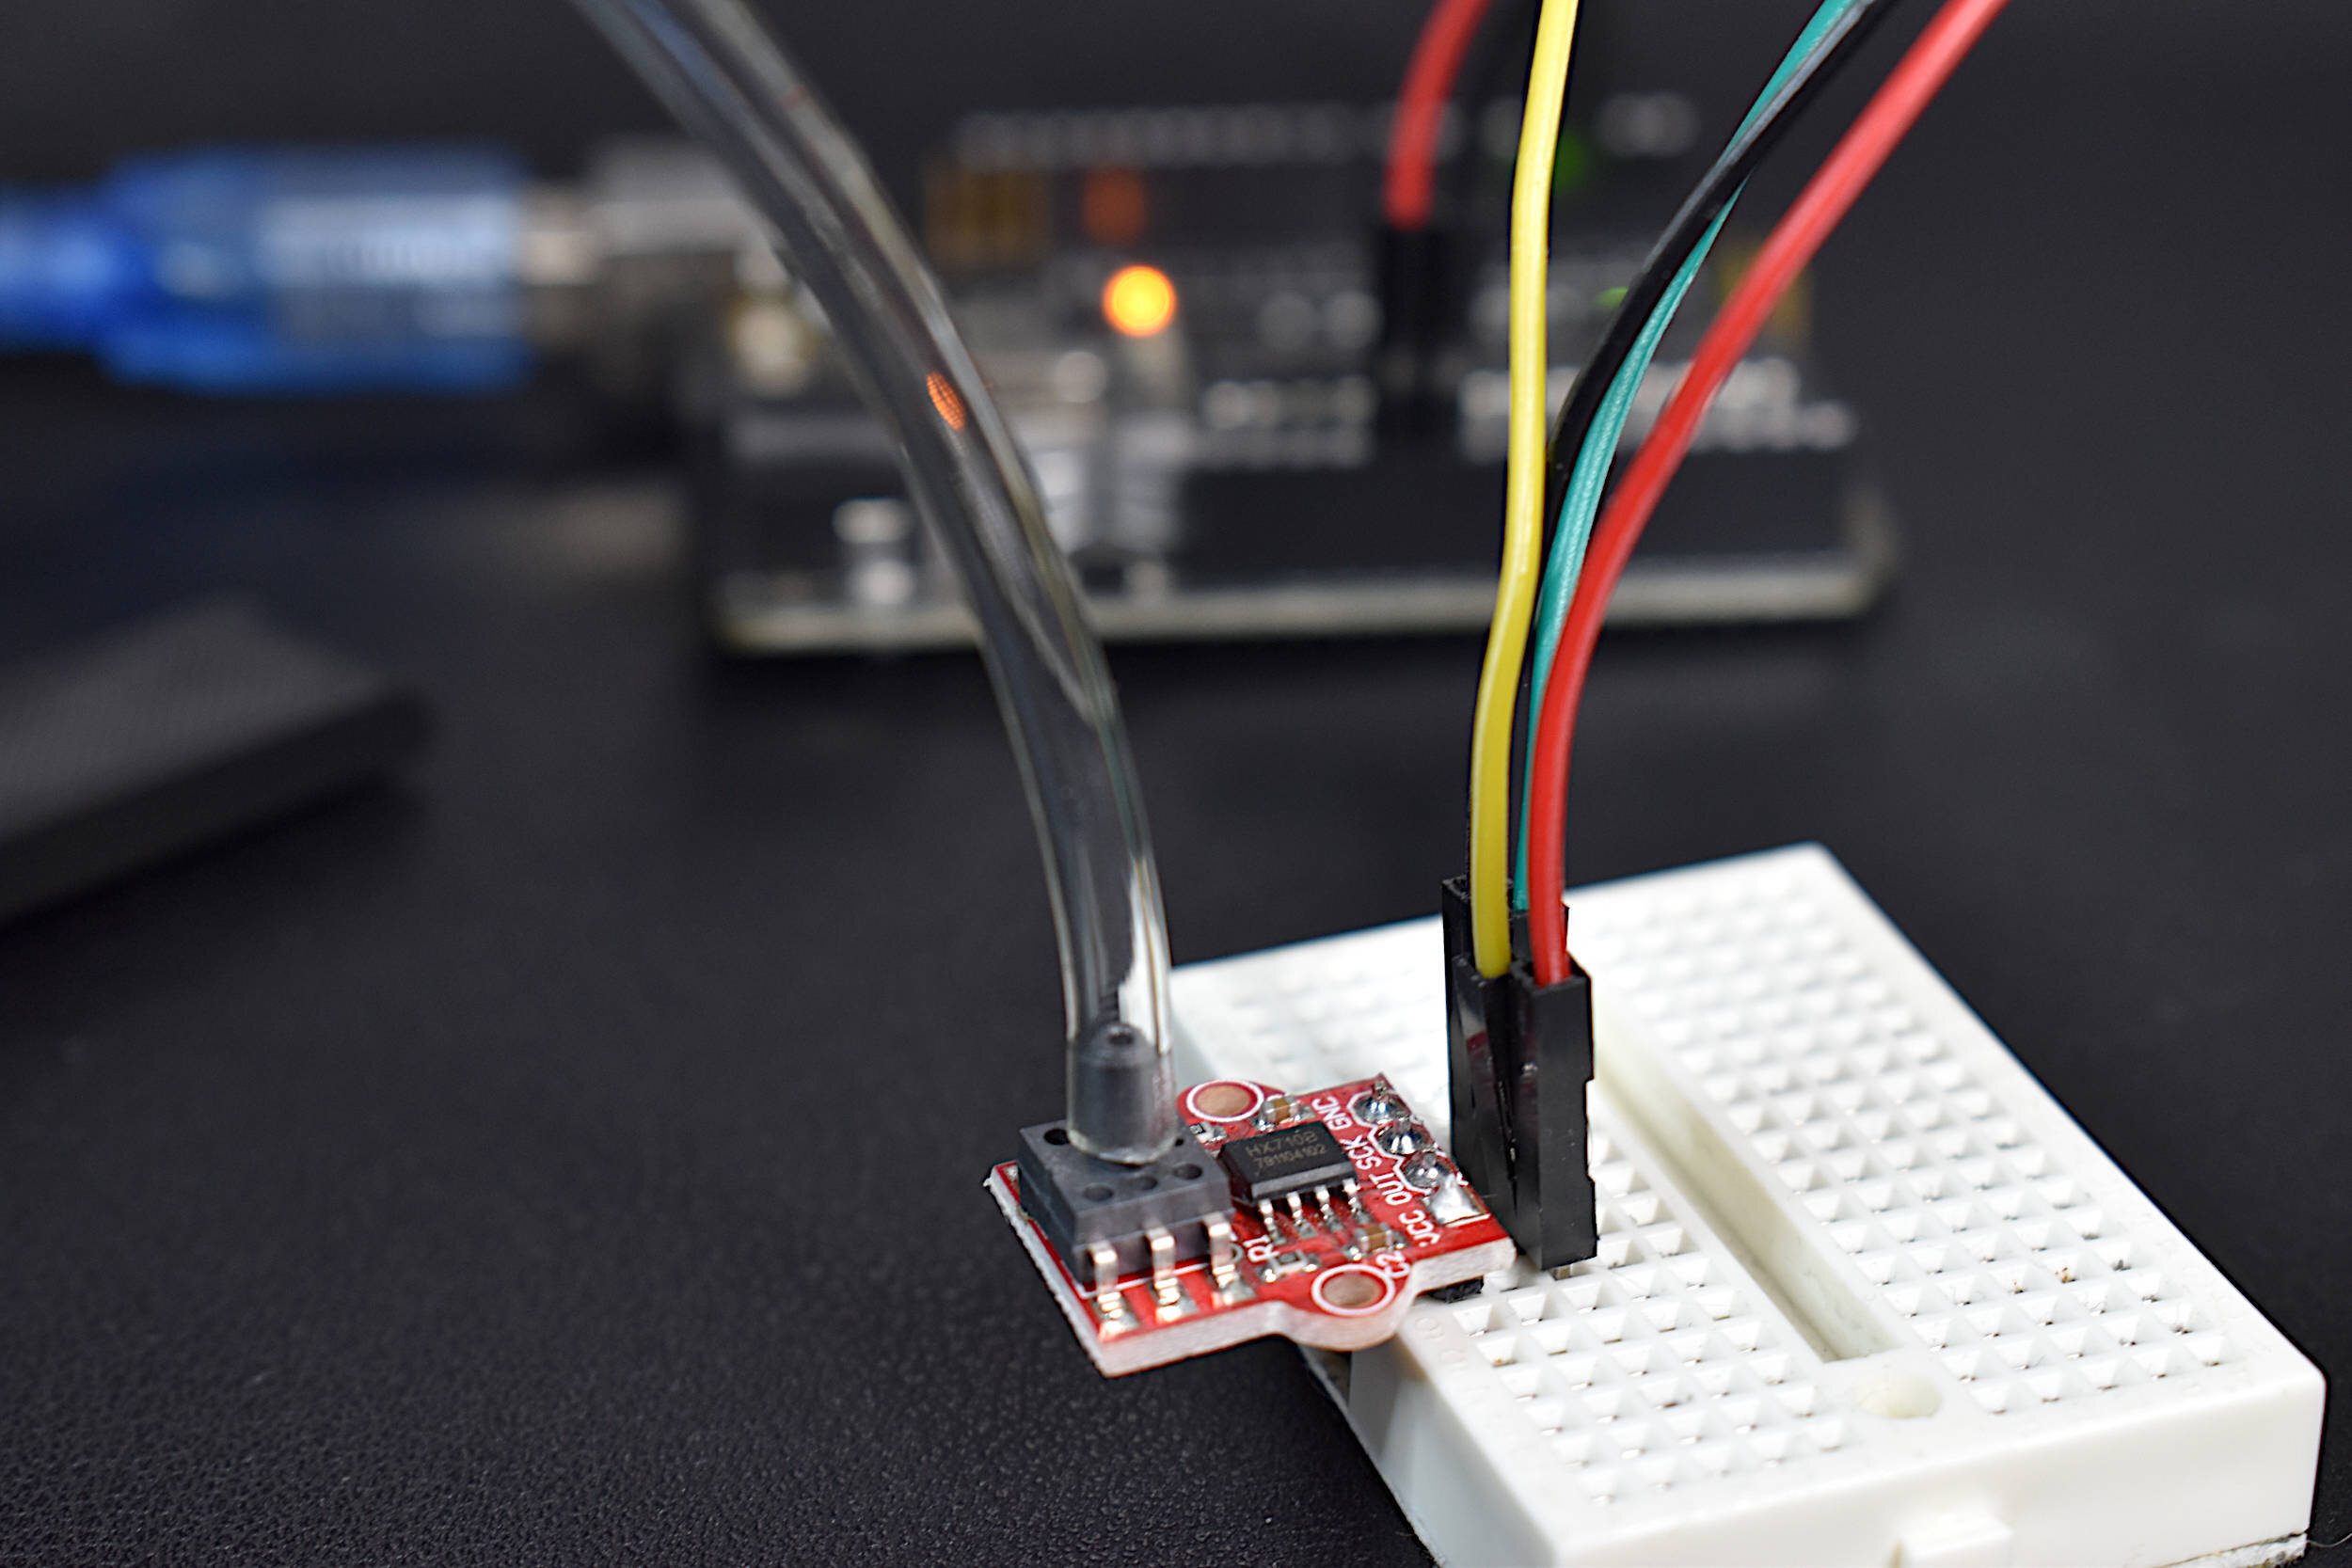
The wiring between the MPS20N0040D pressure transducer and Arduino board is also given below:
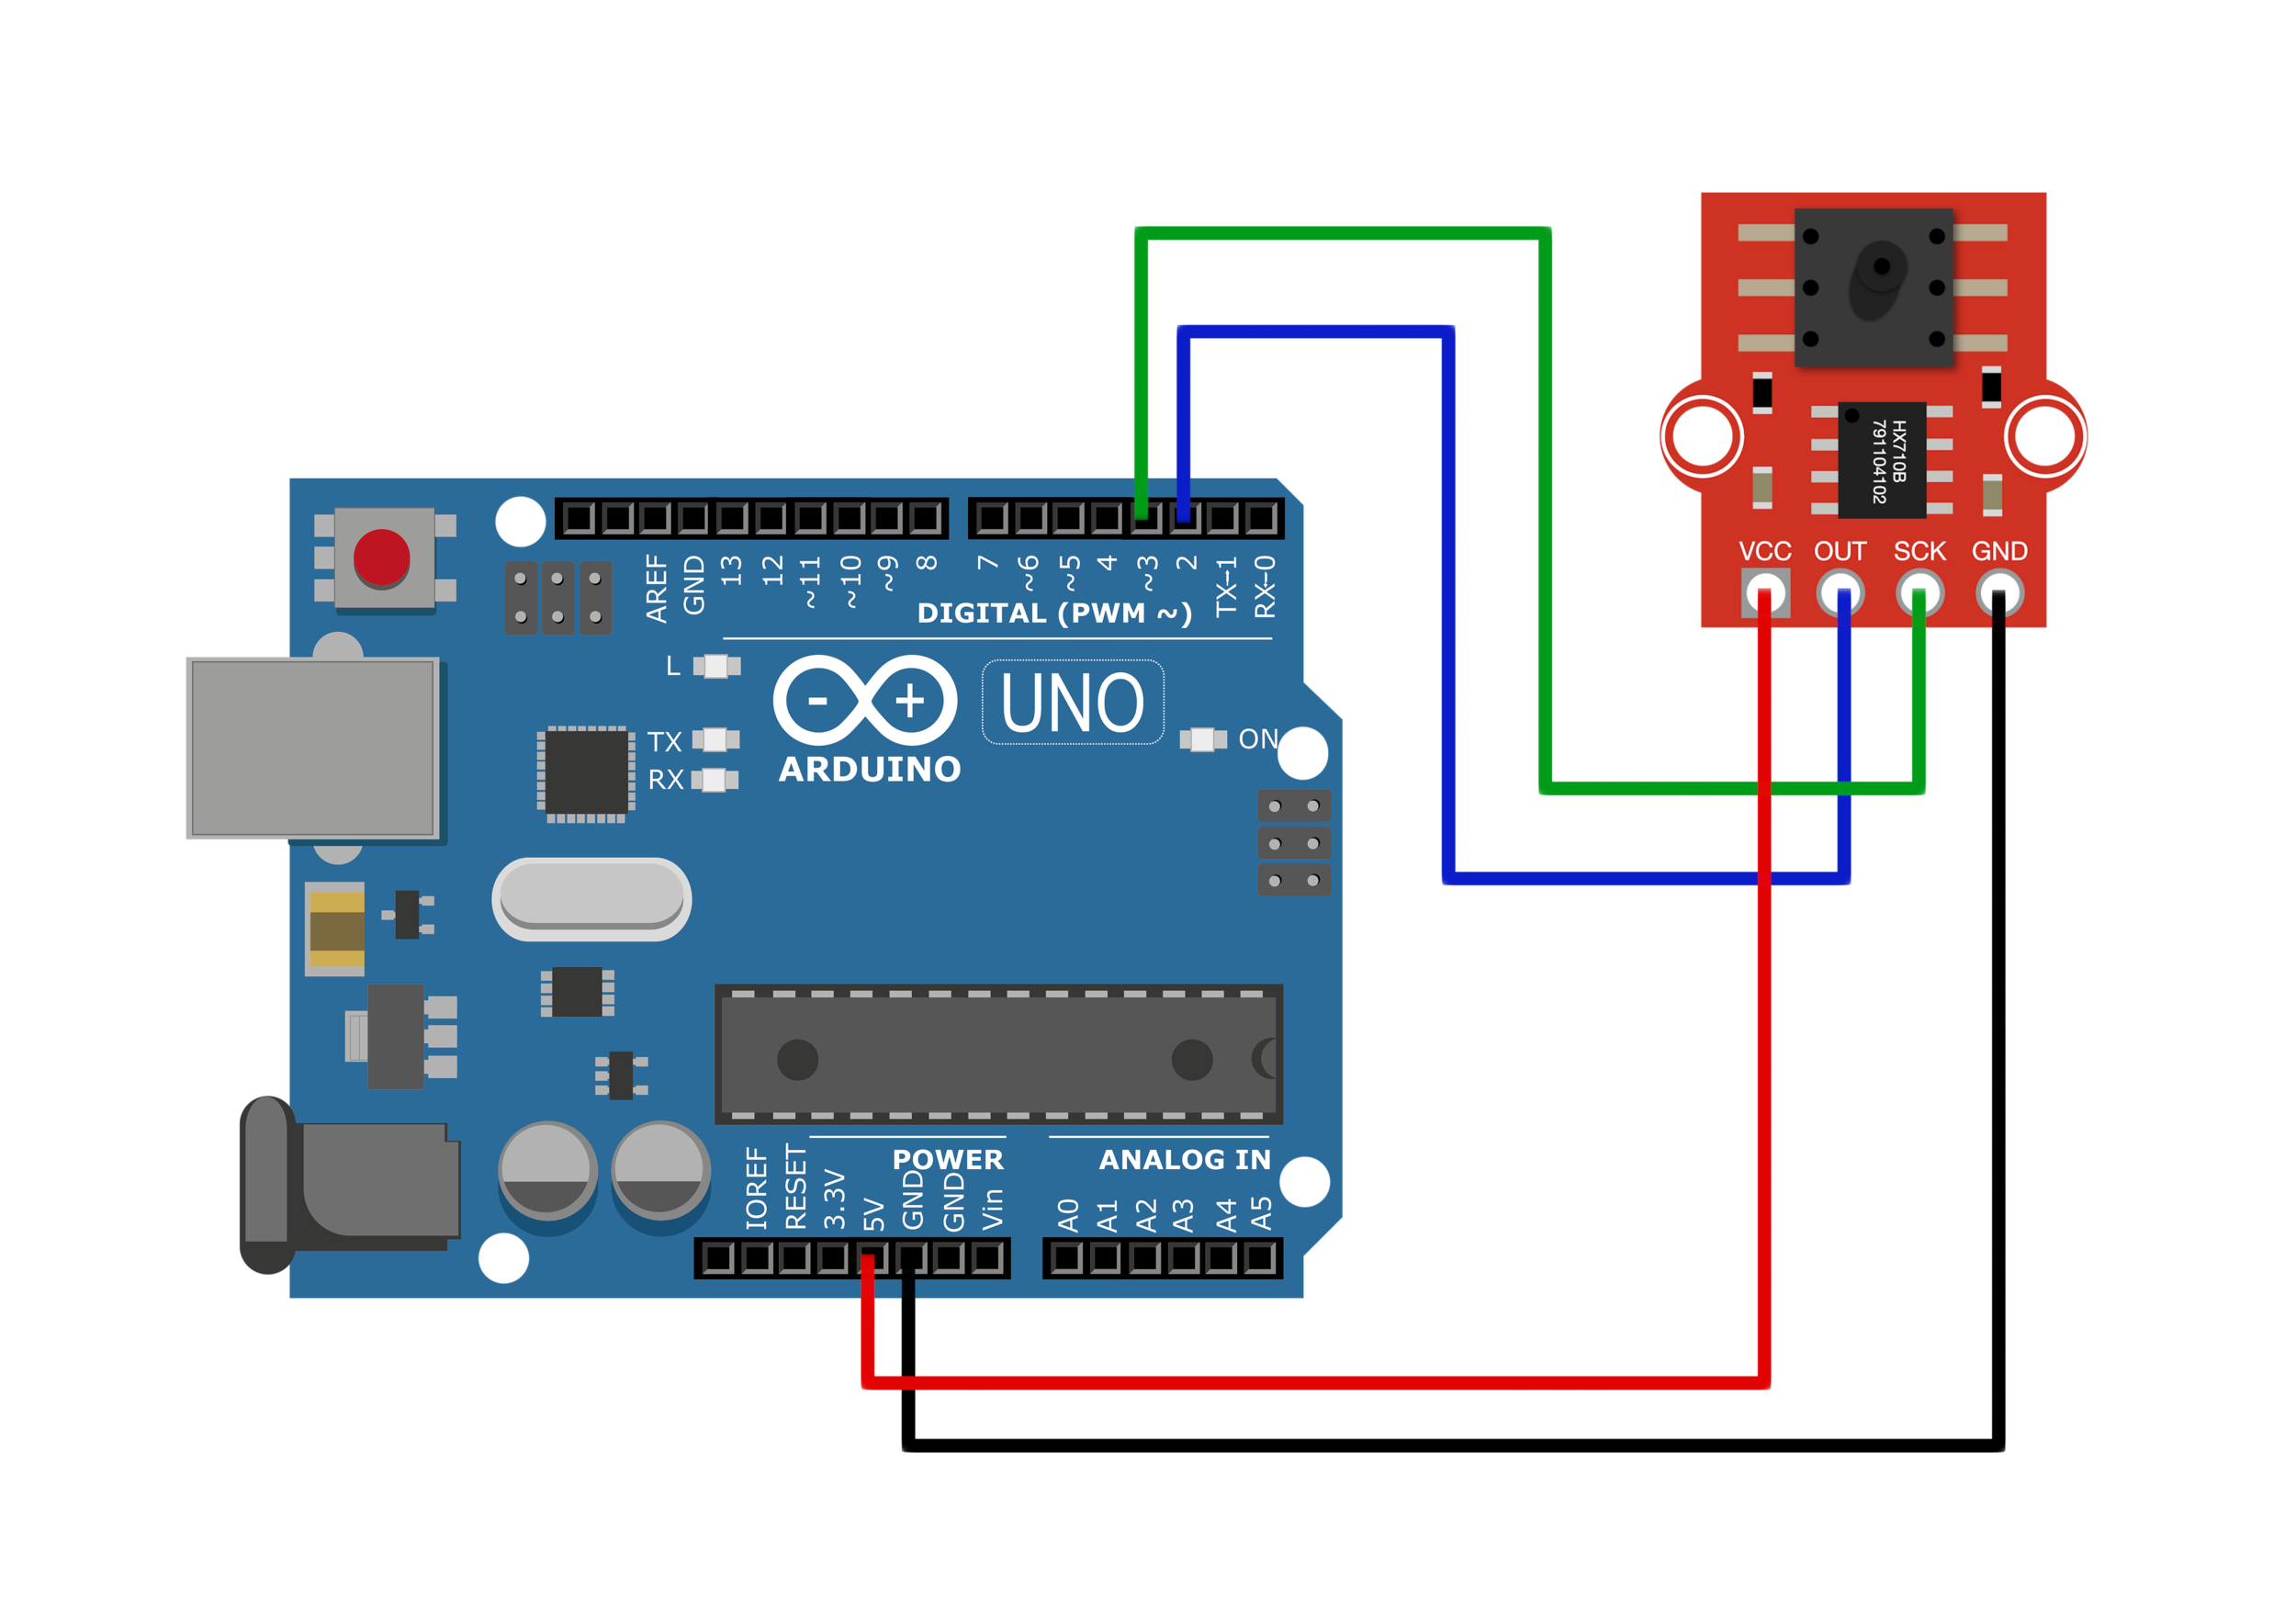
The Arduino code used to read the MPS20N0040D is given below:
/*
Pressure Measurements with the
MPS20N0040D Breakout Board
with the HX710B/HX711 ADC
5V Supply Voltage
 */
#include <Q2HX711.h>

const byte MPS_OUT_pin = 2; // OUT data pin
const byte MPS_SCK_pin = 3; // clock data pin
int avg_size = 10; // #pts to average over

Q2HX711 MPS20N0040D(MPS_OUT_pin, MPS_SCK_pin); // start comm with the HX710B

void setup() {
  Serial.begin(9600); // start the serial port
}

void loop() {
  float avg_val = 0.0; // variable for averaging
  for (int ii=0;ii<avg_size;ii++){
    avg_val += MPS20N0040D.read(); // add multiple ADC readings
    delay(50); // delay between readings
  }
  avg_val /= avg_size;
  Serial.println(avg_val,0); // print out the average
}
The code above simply averages over 10 ADC readings from the MPS20N0040D breakout board and outputs them to the serial port. This will allow calibration of the sensor’s output in terms of the pressure read from the manometer.
Experimental Setup
The manometer and MPS20N0040D sensor will be connected via an air pressure tubing configuration, where a tee junction will be used so that different pressures can be applied. It is also recommended that either a valve or syringe is used to keep the pressure consistent during measurements. A simple air pressure connection diagram with all the components is shown below:

The incident pressure, P, can be any application of pressure: a bicycle pump, breath from lungs, a syringe, electronic air pump, etc. - the method of increasing and decreasing the air pressure in the tee junction is not important. The main requirement is that the pressure must be static enough to measure consistent and stable measurements both at the manometer’s column height and the transducer’s digital signal.
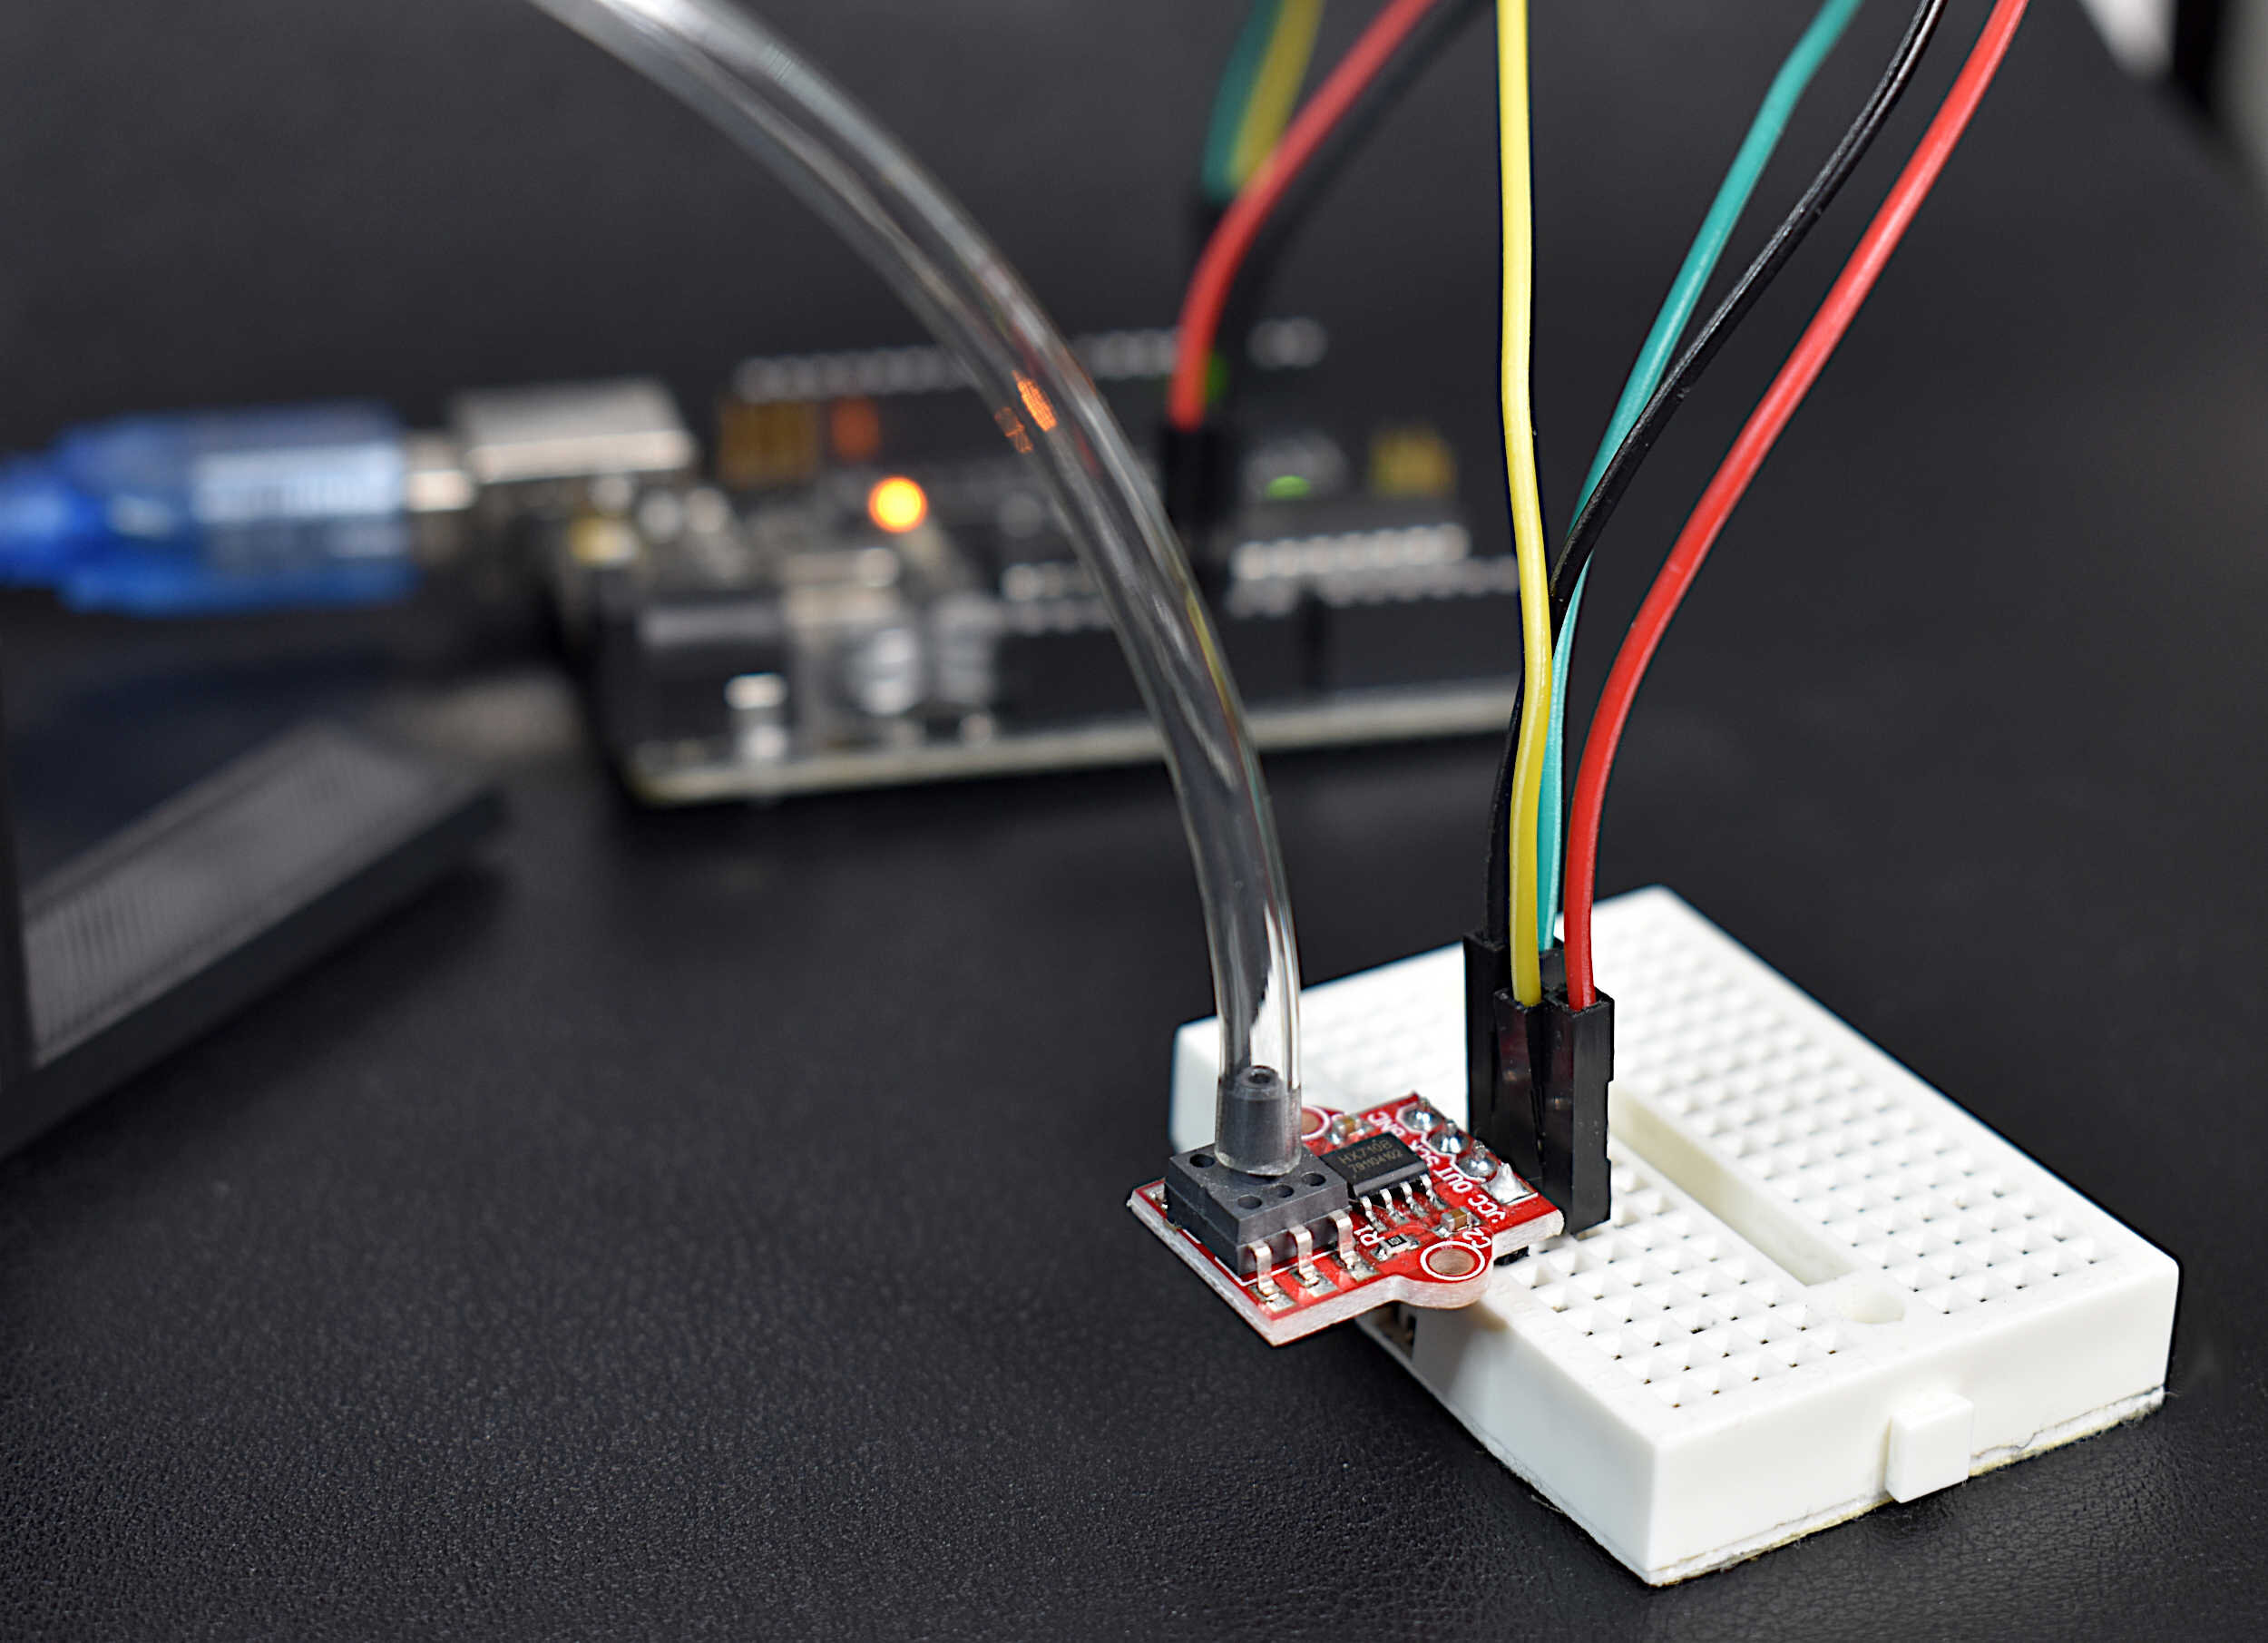
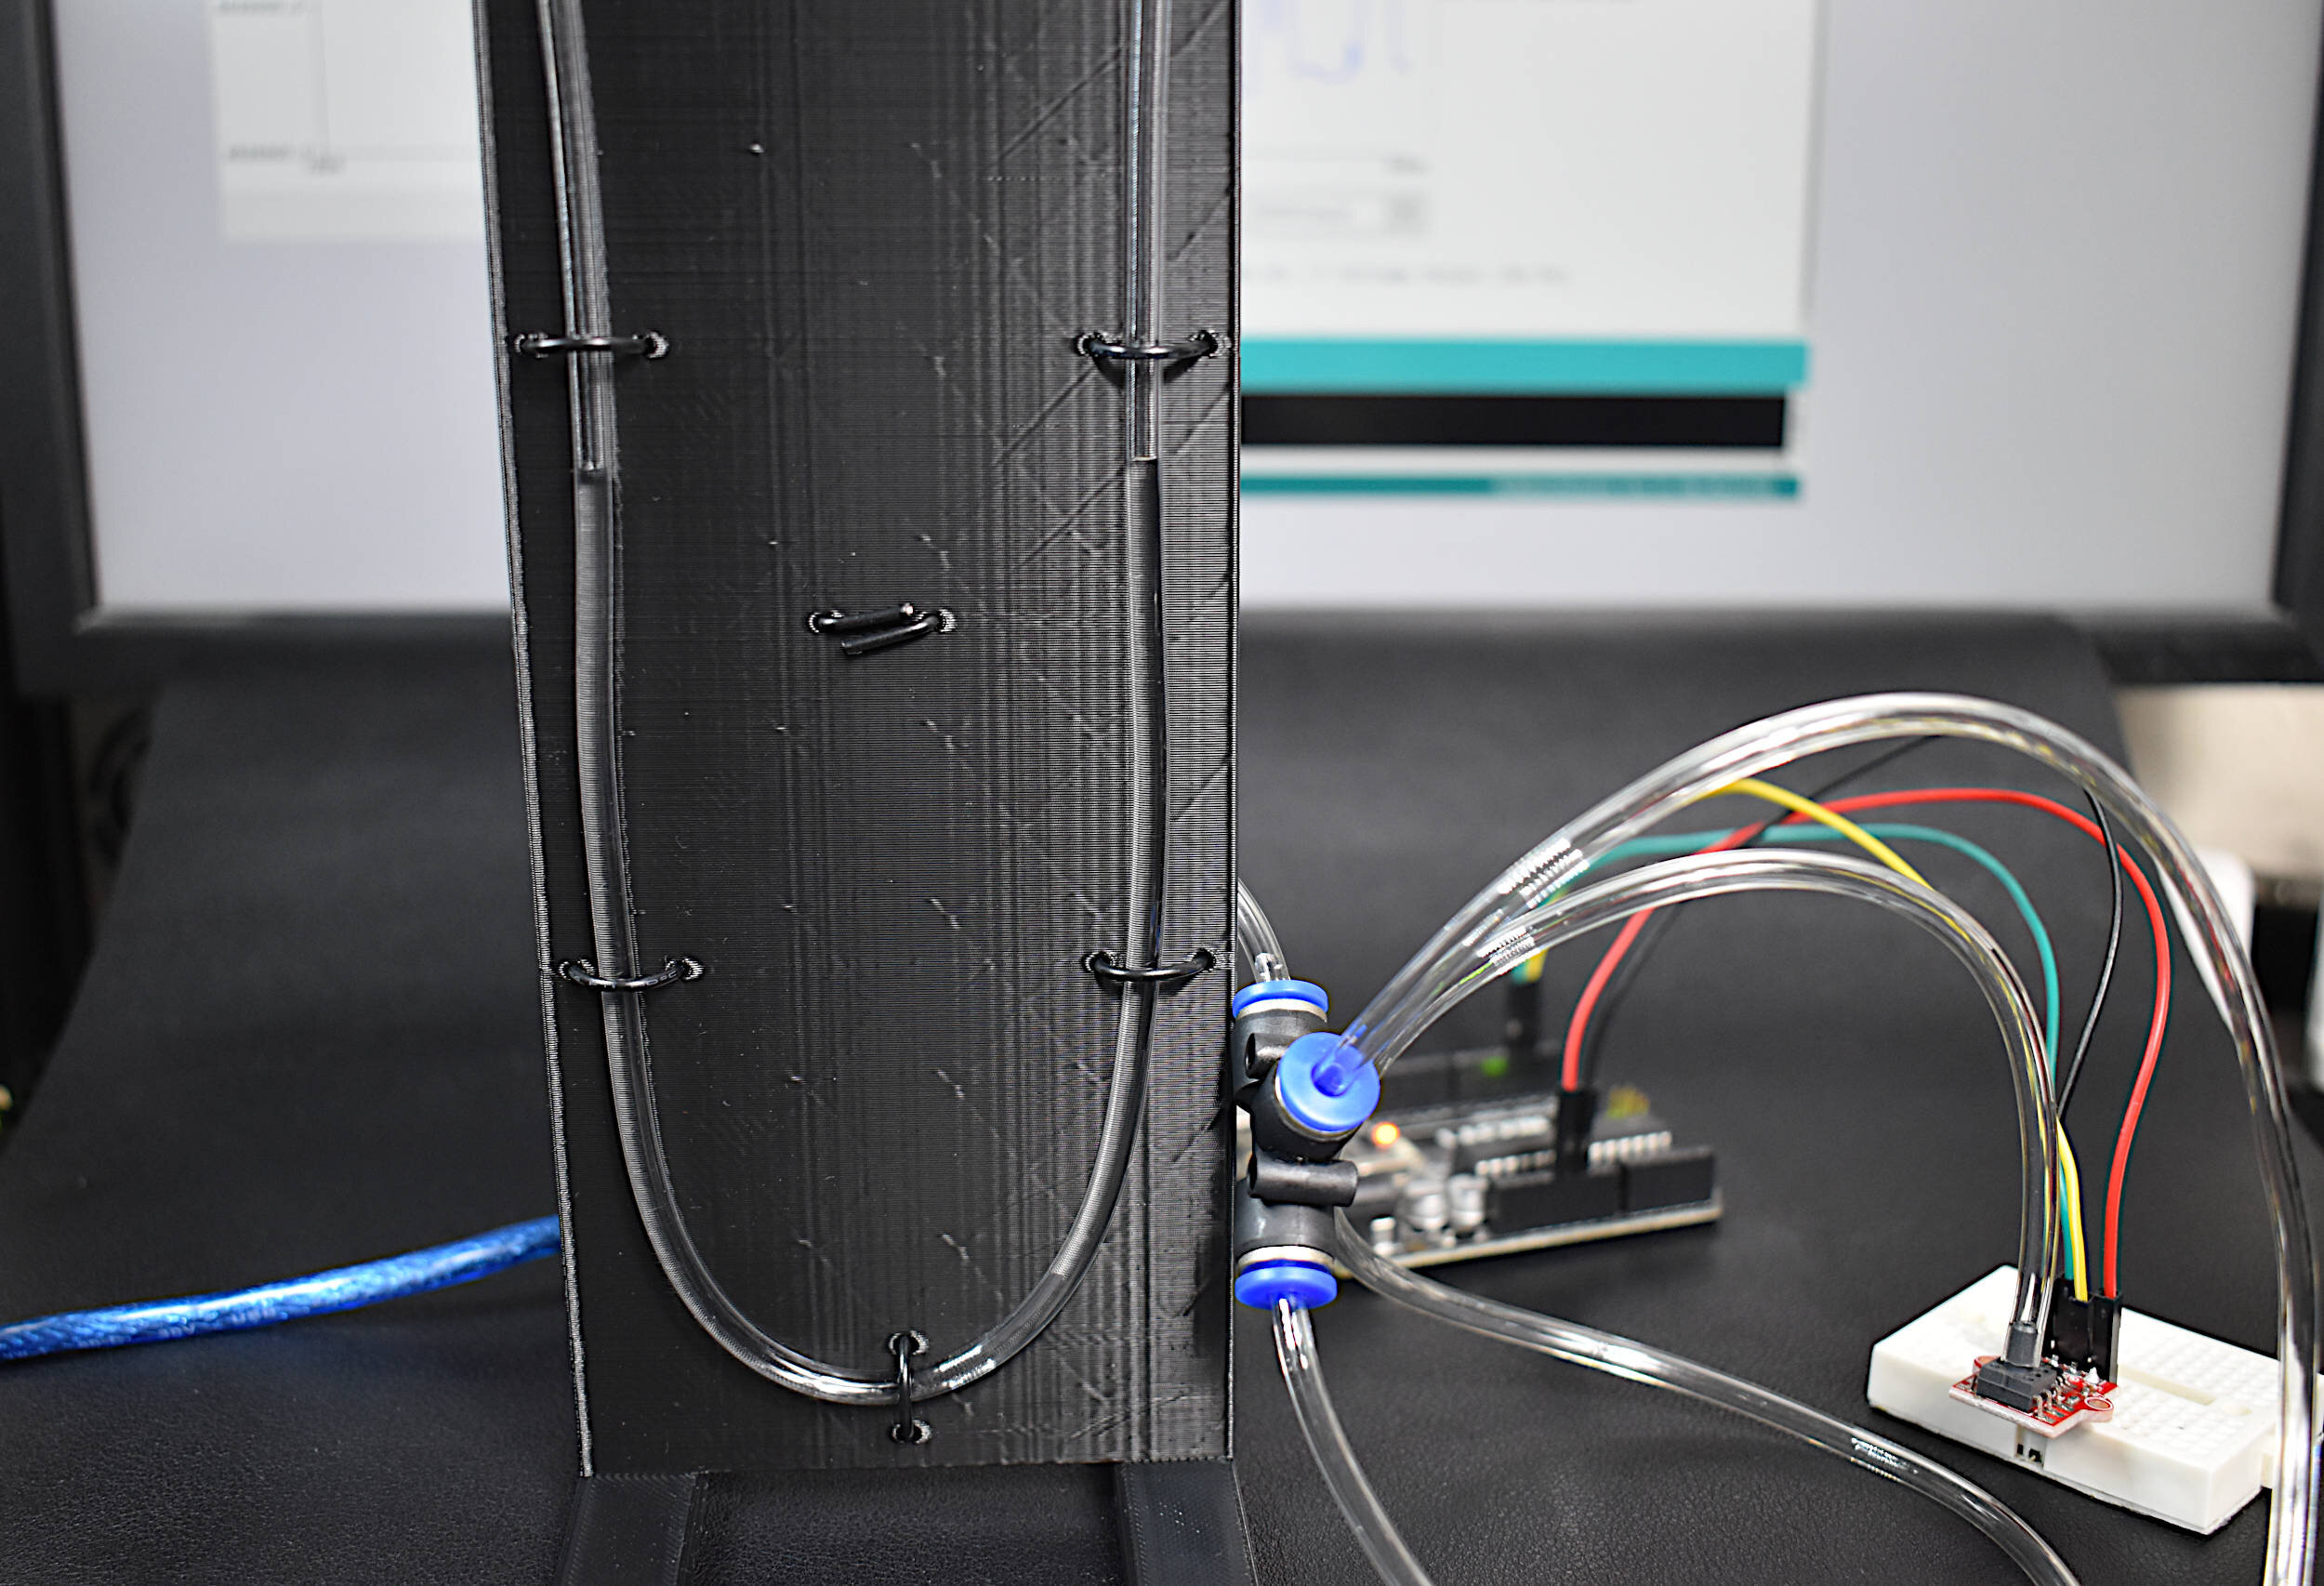
Photo of Experimental setup:

The MPS20N0040D pressure sensor should be wired to the Arduino board and connected to the tee junction tubing. The manometer should also be connected to the tee junction. And finally, the chosen method of pressure application should be connected to the last input at the tee junction. The method of calibration involves varying the pressure input to change the height of the water column in the U-tube manometer. This will allow us to record measurements of the manometer (a caliper is an accurate measurement of column height), and use those pressure measurements to fit the voltage response of the MPS20N0040D.
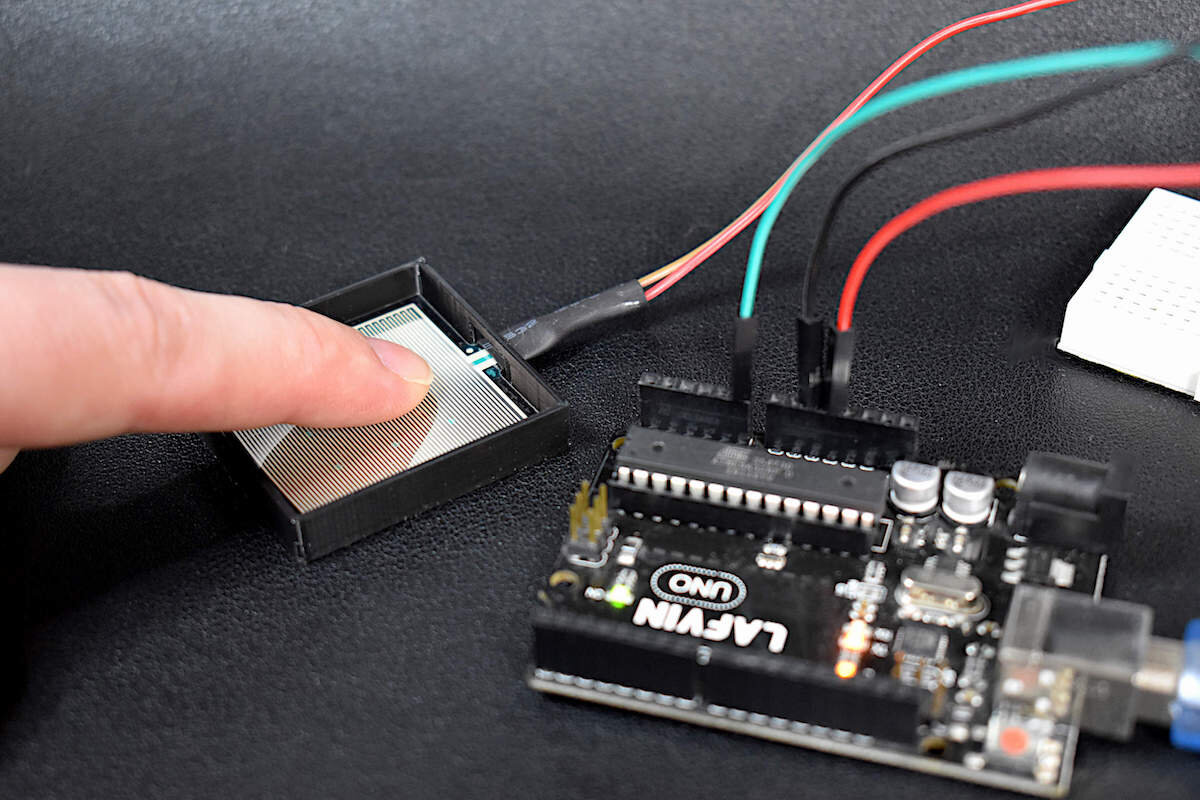
Below is a video demonstration of the input pressure affecting the height of the water column in the manometer as well as the reading on the MPS20N0040D:
The basic calibration process for the MPS20N0040D is similar to the one outlined in this document. Essentially, the height of the water column in the manometer needs to be varied such that different values can be approximated as different pressures, both positive and negative (pushing and suction). A syringe is used here to change the height of the manometer water column, as well as a ball valve to keep the pressure from leaking. Thus, measurements at different ADC values from the MPS20N0040D can be logged along with different column level heights (measured by the caliper).
Another video demonstration is shown below of the calibration process, where the valve is closed and keeps the manometer column height steady in order to take proper measurements:
After taking several data points (we took about 8 negative and 8 positive), we can look at the relationship between the ADC value and the manometer pressure approximation.
Using the 16 calibration points acquired from the manometer water column height digital ADC readings, the points can be plotted against one another to arrive at the following:

And this is an incredibly important result. Just as expected, the pressure transducer’s digital response is linearly related to the manometer column height under varying input pressures. Returning to the pressure relationship as a function of column height:
Next, we want to look at the MPS20N0040D ADC response. Remembering that the HX710B amplifies the signal of the pressure transducer by 128x and wraps the response around a 0V - 5V signal, we can state the following relationship:
Using both representations of the sensor voltage and manometer pressure, we can construct the following plot relating the two:

Above, we can finally see how the response of the sensor relates to the real-world pressure values. And the response is as expected: the pressure transducer is zero around 25mV (really closer to 22.6mV), and the values of pressure are in the kPa range.
Now, if we return to the relationship between the voltage output of the MPS20N0040D, its offset voltage, and the operating pressure range, we can begin to understand how the sensor might be calibrated:

It is easy to see that our data is highly misaligned with the theory, but the behavior is the similar. Thus, we are on the right track, but need to make a few adjustments. The first is that we can incorporate the new offset as 22.6mV, instead of 25mV. This will immediately improve the relationship between the data and the theoretical curve. Second, we can attempt to fit the value for S using a least-squares relationship, which will really narrow down the error between theory and data.
Fitting the data and the offset as described above, we can arrive at the following relationship between MPS20N0040D voltage and incident pressure:

Using the slope and intercept of the least-squares linear fit, we can make a better approximation for the sensitivity factor, S. For zero applied pressure, we can find the corresponding value for voltage (the offset).
We can see how the offset value of 22.6mV was derived (the intercept multiplied by 1/slope), and now we can finally see how the slope from the linear fit relates to the sensitivity:
Finally, we can write the sensitivity in terms of the 50mV voltage span:
Thus, the sensitivity is approximately 50mV/29.5kPa, which is a slight deviation from the 50mV/40kPa claimed in the datasheet. So finally, we can write the response of the MPS20N0040D transducer in terms of the derived parameters relating to its physical and electrical characteristics:
And this is the final calibrated pressure equation for the MPS20N0040D pressure transducer breakout board that takes an ADC value, X, and approximates pressure, P, in kPa.
The resulting error (shown in the final plot above) is around 4%, which is really remarkable considering how inexpensive the pressure transducer is!
Now that we know the sensitivity, we can also make statements about the resolution of the MPS20N0040D pressure transducer. The HX710B ADC has 24-bit resolution, and we know the sensor spans 50mV/29.5kPa, thus, we expect the ADC to have a resolution of roughly 1.76bits/Pa, which is fairly high resolution for the range it is able to capture. As a comparison, the 10-bit resolution of the Arduino’s ADC is capable of outputting a resolution of 0.26bits/Pa for another common sensor, the MPXV7002DP. One thing to note is that after testing several sensors - they do not all agree in sensitivity and offset. Therefore, the user must calibrate each sensor in order to provide an accurate representations of pressure.
The MPS20N0040D pressure transducer breakout board was introduced along with its calibration using an analog manometer. The MPS20N0040D is a significant demonstration of the need for calibration, where the statements made in its datasheet were found to be either false or unnecessarily vague. Thus, the theory and implementation of manometry and pressure sensing was introduced. Using an Arduino microcontroller and the MPS20N0040D breakout board (with an onboard amplifier), we were able to record digital values measured by the pressure transducer and compare them directly with a manometer. After measuring several positive and negative data points at different water column heights on the manometer, the values were compared with those measured by the pressure transducer. Using the hydrostatic assumption, pressure was approximated from the manometer water levels and plotted in terms of the values measured on the digital pressure sensor. The relationship between the two was fitted using a linear least-squares method, which resulted in the proper calibration of the MPS20N0040D. The pressure sensor constants found in the fit were close to those stated in the datasheet, but far enough to require proper calibration. The DC offset was established to be 22.6mV, instead of 25mV, whereas the sensitivity was found to be 50mV/29.5kPa, rather than 50mV/40kPa. These two adjustments resulted in an error of 4% when compared to manometer measurements, indicating very good linearity between the transducer and manometer.

See More in Engineering and Arduino: